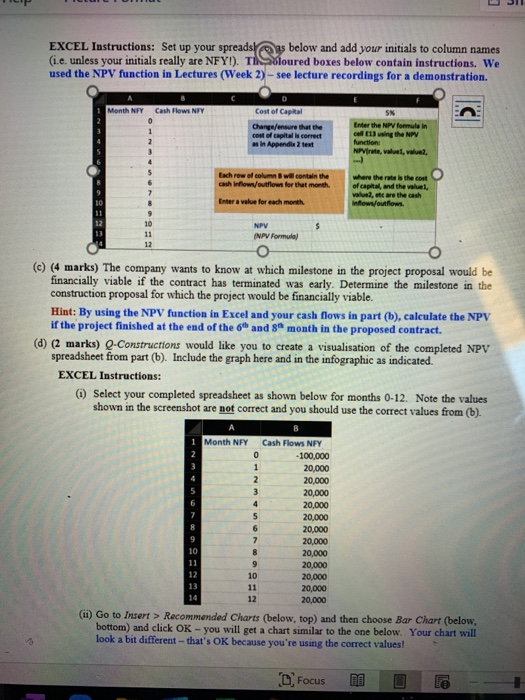
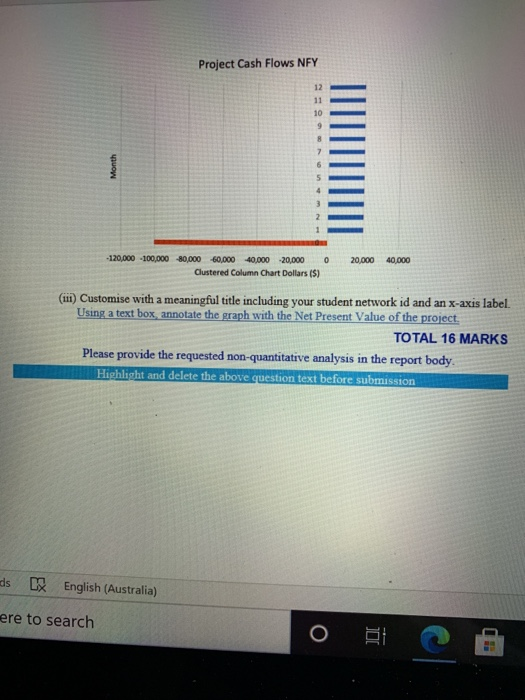
Insert Draw Review Design Layout References Mailings Include the details of your working out in this appendix WX After analysing the financial data of Q-Constructions, you notice that they are trending in the right direction. A new 12-month construction proposal has come to the company worth $1,000,000 and an important question is whether it will be financially viable. They want you to analyse the proposal, in particular, the recommended cash flow schedule and to understand the key financial points during the construction project. The following cash flow schedule is summarised below. To ensure that all upfront and on-going outlay costs are covered in advance, Q-Constructions incur an initial start-up cost of $200,000. The proposal states that they will receive a deposit from the client of 10% of the total project price at the beginning. They then receive four equal instalment payments of 20% of the total project price associated to project milestones from the client at the end of the 2nd, 6 gaand 10 month. Finally, they receive the last 10% project milestone on lock-up which occurs at the end of the 12 month. Q-Constructions has ongoing project costs of $20,000 to pay salaries and services at the end of each month. In additional, there are material costs of $100,000 associated for each of the project milestones at the end of the 24.6gh and 10th month. The current cost of capital for company is 8% per annum compounded monthly. You have been tasked with the important objective to determine whether this future project is financially viable. In addition, they want you to determine which milestone is needed to be completed in the project proposal such that it will be financially viable. It's time to show your Quants knowledge and expertise with Excel to determine the financial viability of this project (a) (4 marks) In a worst-case scenario where the project does not proceed, and the initial outlay is paid. Calculate the amount of interest that would have accrued on an amount of $200,000 at the end of 12 months with an interest rate of 8% pa compounded monthly. Do not use EXCEL for this calculation (6) (6 marks) Set up a cash inflow and outflow for the 12-month construction project proposal based on the information provided by the company above. By using the current 8% p.a compounded monthly cost of capital, calculate the Net Present Value of this proposal and whether it is financially viable project. Use EXCEL to calculate the net present value of the current situation. For full marks show: 1. The full spreadsheet with all completed entries. Show how you entered cash inflow and cash outflow amounts at the beginning, 1", 20, 31 months. You can type this in Word. 2. The NPV calculation (showing the calculation via the Excel function NPV and Excel cell references is OK). You can show this either in the spreadsheet or type it in Word. 8 words English (Australia) e here to search " EXCEL Instructions: Set up your spreadsy below and add your initials to column names (i.e. unless your initials really are NFY!). Tioloured boxes below contain instructions. We used the NPV function in Lectures (Week 2) - see lecture recordings for a demonstration. Month NFY Cash Flows NFY D Cost of Capital Change/ensure that the cost of capital is correct as in Appendix 2 text SX Enter the NPV formula in cell 13 wing the NPV function: NPVre, value, value 1 2 3 4 5 6 7 8 9 10 Each row of columns will contain the cash flow/evtflows for that month. where there is the cost of capit, and the value, vare the cash Inflow/outflows. 10 Enter a value for each month 12 $ NPV (NPV Formula 12 (c) (4 marks) The company wants to know at which milestone in the project proposal would be financially viable if the contract has terminated was early. Determine the milestone in the construction proposal for which the project would be financially viable. Hint: By using the NPV function in Excel and your cash flows in part (b), calculate the NPV if the project finished at the end of the 6 and 8 month in the proposed contract. (d) (2 marks) Q-Constructions would like you to create a visualisation of the completed NPV spreadsheet from part (b). Include the graph here and in the infographic as indicated. EXCEL Instructions: Select your completed spreadsheet as shown below for months 0-12. Note the values shown in the screenshot are not correct and you should use the correct values from (b). WN Month NFY Cash Flows NFY 0 -100,000 1 20,000 2 20,000 3 20,000 4 20.000 5 20,000 6 20,000 7 20.000 8 20,000 9 20,000 12 10 20,000 11 20,000 12 20,000 (ii) Go to Insert > Recommended Charts (below, top) and then choose Bar Chart (below, bottom) and click OK - you will get a chart similar to the one below. Your chart will look a bit different - that's OK because you're using the correct values! C Focus 0 Project Cash Flows NFY 12 10 Month -120,000 -100,000 -80,000 60,000 40,000 20,000 0 Clustered Column Chart Dollars (S) 20,000 40,000 (11) Customise with a meaningful title including your student network id and an x-axis label. Using a text box, annotate the graph with the Net Present Value of the project. TOTAL 16 MARKS Please provide the requested non-quantitative analysis in the report body Highlight and delete the above question text before submission ds DX English (Australia) ere to search o gt Insert Draw Review Design Layout References Mailings Include the details of your working out in this appendix WX After analysing the financial data of Q-Constructions, you notice that they are trending in the right direction. A new 12-month construction proposal has come to the company worth $1,000,000 and an important question is whether it will be financially viable. They want you to analyse the proposal, in particular, the recommended cash flow schedule and to understand the key financial points during the construction project. The following cash flow schedule is summarised below. To ensure that all upfront and on-going outlay costs are covered in advance, Q-Constructions incur an initial start-up cost of $200,000. The proposal states that they will receive a deposit from the client of 10% of the total project price at the beginning. They then receive four equal instalment payments of 20% of the total project price associated to project milestones from the client at the end of the 2nd, 6 gaand 10 month. Finally, they receive the last 10% project milestone on lock-up which occurs at the end of the 12 month. Q-Constructions has ongoing project costs of $20,000 to pay salaries and services at the end of each month. In additional, there are material costs of $100,000 associated for each of the project milestones at the end of the 24.6gh and 10th month. The current cost of capital for company is 8% per annum compounded monthly. You have been tasked with the important objective to determine whether this future project is financially viable. In addition, they want you to determine which milestone is needed to be completed in the project proposal such that it will be financially viable. It's time to show your Quants knowledge and expertise with Excel to determine the financial viability of this project (a) (4 marks) In a worst-case scenario where the project does not proceed, and the initial outlay is paid. Calculate the amount of interest that would have accrued on an amount of $200,000 at the end of 12 months with an interest rate of 8% pa compounded monthly. Do not use EXCEL for this calculation (6) (6 marks) Set up a cash inflow and outflow for the 12-month construction project proposal based on the information provided by the company above. By using the current 8% p.a compounded monthly cost of capital, calculate the Net Present Value of this proposal and whether it is financially viable project. Use EXCEL to calculate the net present value of the current situation. For full marks show: 1. The full spreadsheet with all completed entries. Show how you entered cash inflow and cash outflow amounts at the beginning, 1", 20, 31 months. You can type this in Word. 2. The NPV calculation (showing the calculation via the Excel function NPV and Excel cell references is OK). You can show this either in the spreadsheet or type it in Word. 8 words English (Australia) e here to search " EXCEL Instructions: Set up your spreadsy below and add your initials to column names (i.e. unless your initials really are NFY!). Tioloured boxes below contain instructions. We used the NPV function in Lectures (Week 2) - see lecture recordings for a demonstration. Month NFY Cash Flows NFY D Cost of Capital Change/ensure that the cost of capital is correct as in Appendix 2 text SX Enter the NPV formula in cell 13 wing the NPV function: NPVre, value, value 1 2 3 4 5 6 7 8 9 10 Each row of columns will contain the cash flow/evtflows for that month. where there is the cost of capit, and the value, vare the cash Inflow/outflows. 10 Enter a value for each month 12 $ NPV (NPV Formula 12 (c) (4 marks) The company wants to know at which milestone in the project proposal would be financially viable if the contract has terminated was early. Determine the milestone in the construction proposal for which the project would be financially viable. Hint: By using the NPV function in Excel and your cash flows in part (b), calculate the NPV if the project finished at the end of the 6 and 8 month in the proposed contract. (d) (2 marks) Q-Constructions would like you to create a visualisation of the completed NPV spreadsheet from part (b). Include the graph here and in the infographic as indicated. EXCEL Instructions: Select your completed spreadsheet as shown below for months 0-12. Note the values shown in the screenshot are not correct and you should use the correct values from (b). WN Month NFY Cash Flows NFY 0 -100,000 1 20,000 2 20,000 3 20,000 4 20.000 5 20,000 6 20,000 7 20.000 8 20,000 9 20,000 12 10 20,000 11 20,000 12 20,000 (ii) Go to Insert > Recommended Charts (below, top) and then choose Bar Chart (below, bottom) and click OK - you will get a chart similar to the one below. Your chart will look a bit different - that's OK because you're using the correct values! C Focus 0 Project Cash Flows NFY 12 10 Month -120,000 -100,000 -80,000 60,000 40,000 20,000 0 Clustered Column Chart Dollars (S) 20,000 40,000 (11) Customise with a meaningful title including your student network id and an x-axis label. Using a text box, annotate the graph with the Net Present Value of the project. TOTAL 16 MARKS Please provide the requested non-quantitative analysis in the report body Highlight and delete the above question text before submission ds DX English (Australia) ere to search o gt