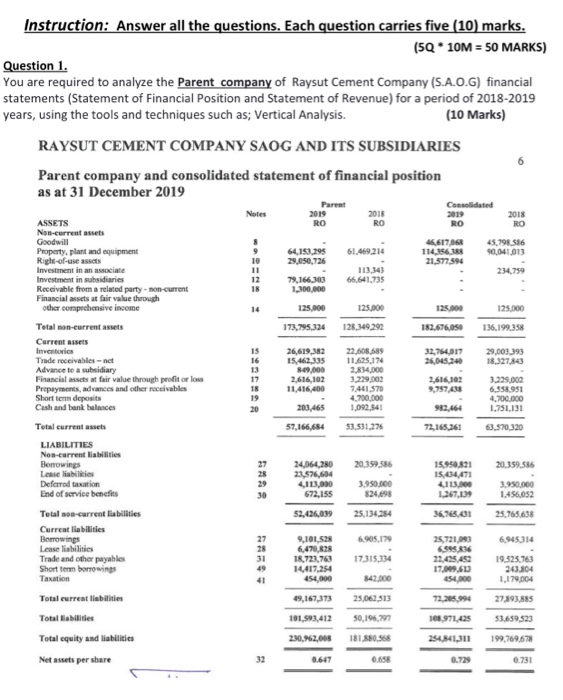
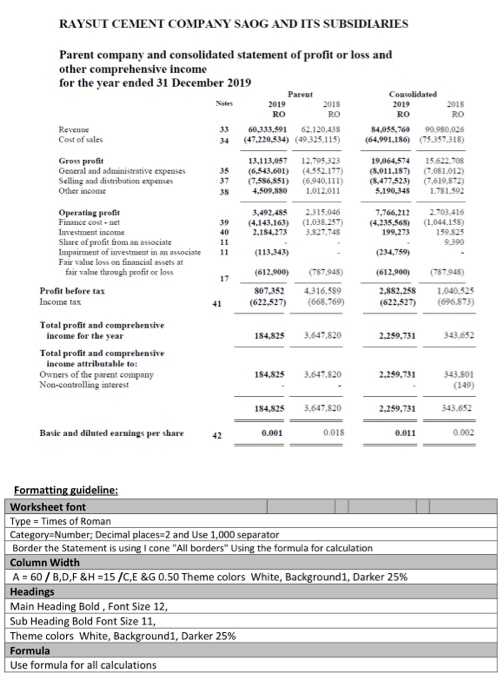
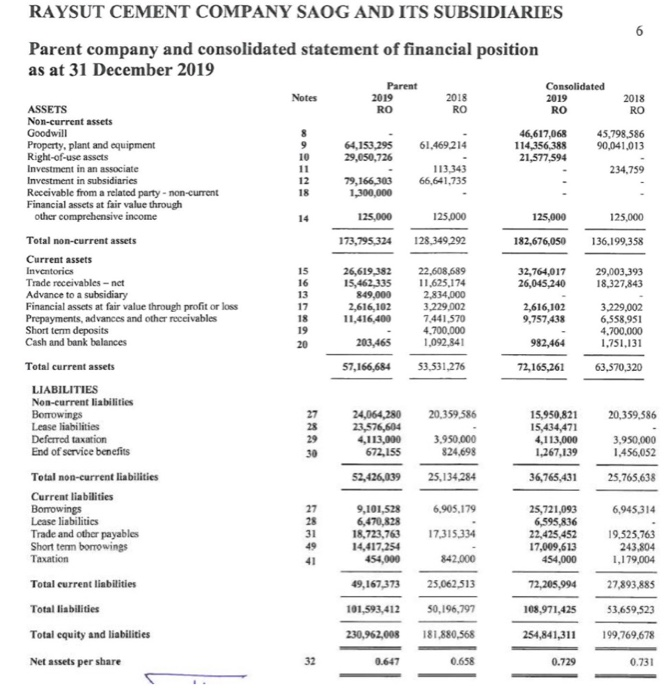
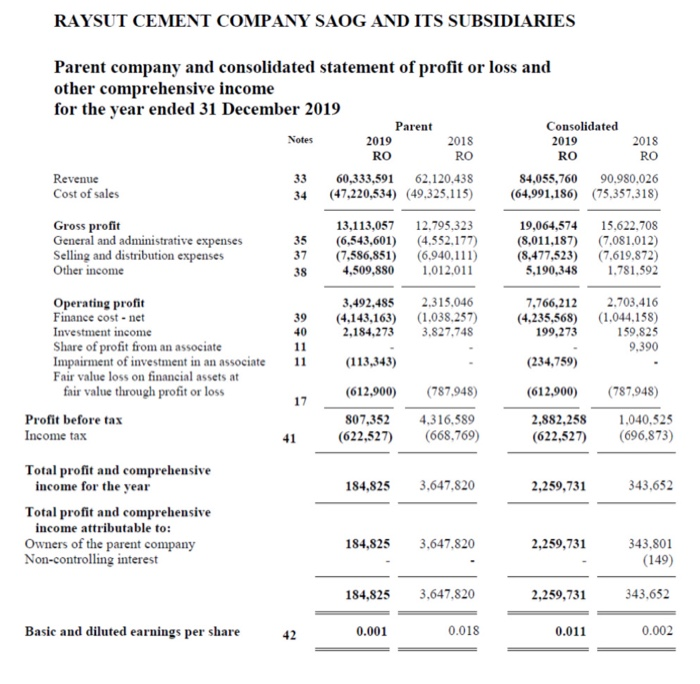
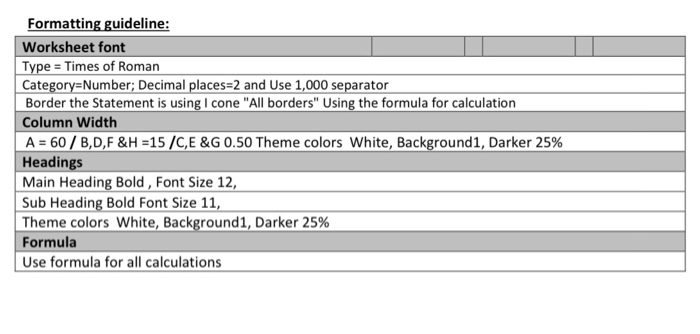
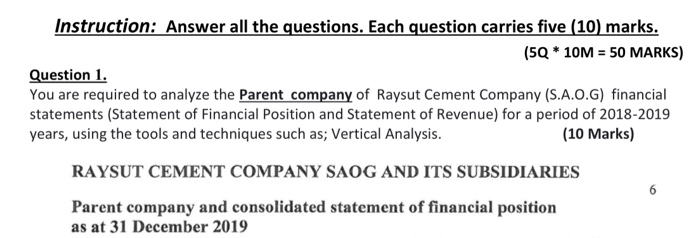
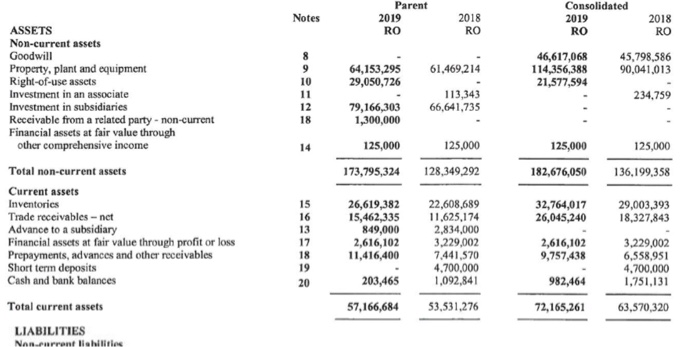
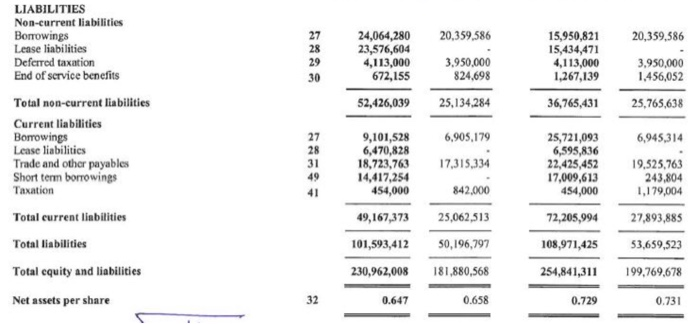
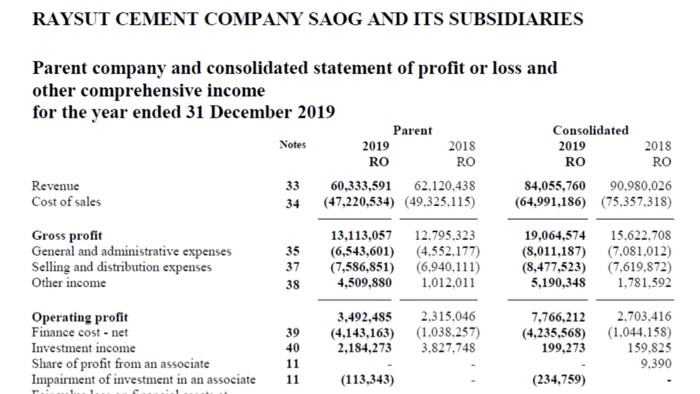
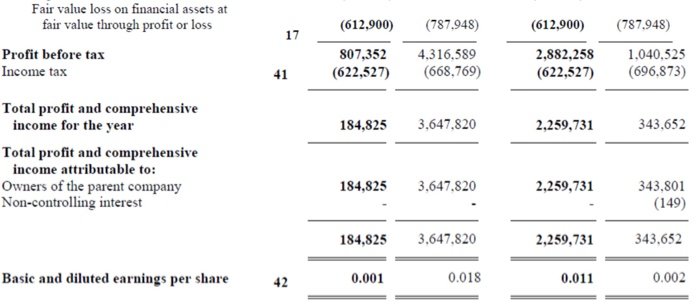
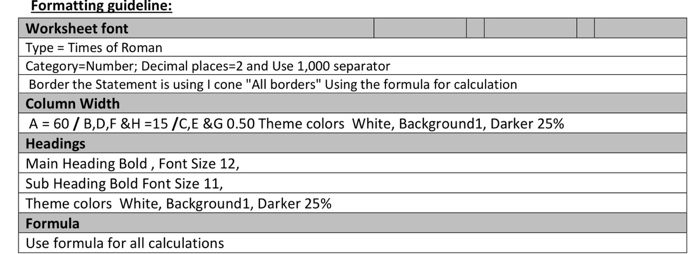
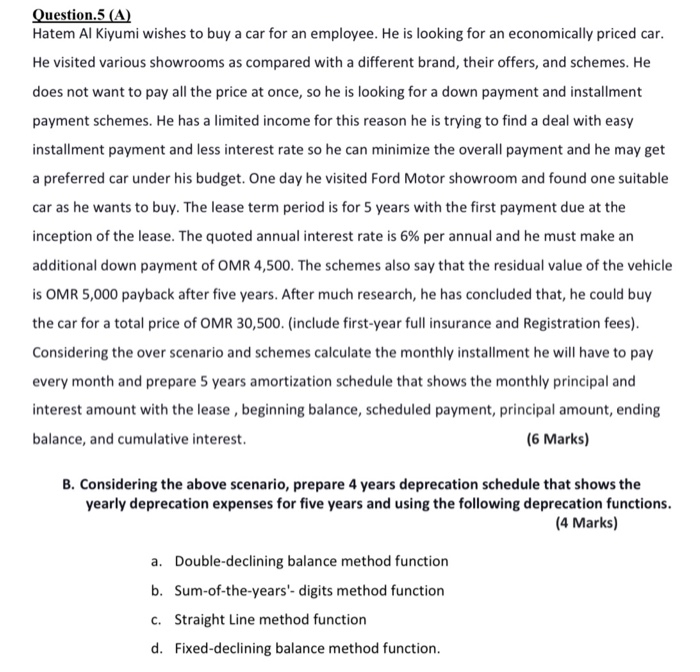
Instruction: Answer all the questions. Each question carries five (10) marks. (5Q10M = 50 MARKS) Question 1. You are required to analyze the Parent company of Raysut Cement Company (S.A.O.G) financial statements (Statement of Financial Position and Statement of Revenue) for a period of 2018-2019 years, using the tools and techniques such as; Vertical Analysis. (10 Marks) RAYSUT CEMENT COMPANY SAOG AND ITS SUBSIDIARIES Parent company and consolidated statement of financial position as at 31 December 2019 Parent Consolidated Notes 2019 RO 2013 RO RO 2018 RO 45,798,586 90,041,013 9 10 46,617068 114,156.188 21.577594 64,153,299 29,050,726 61.469214 113.343 66,641,735 234,759 12 18 79,166,303 1,300,000 14 125,000 125.000 125.000 125.000 ASSETS Non-current assets Goodwill Property, plant and equipment Right-of-use assets Investment in an associate Investment in subsidiaries Receivable from a related party - non-current Financial assets at fair value through other comprehensive income Total man-current assets Current Assets Inventories Trade receivables-net Advance to a subsidiary Financial assets at fair value through profit or loss Prepayments, advances and other receivables Short term deposits Cash and bank balaces 173.795.324 128.349,292 136,199.358 32,764017 26,045.240 29,003,393 18.327.843 15 16 13 19 18 19 20 26,619,382 15,462,335 849,000 2,616,102 11,416,400 22.608.589 11.625.174 2,834.000 3.229.002 7.461,570 4.700.000 1,092,841 2,616,102 9,757,435 3.229.002 6,358951 4.700.000 1.751,131 982,464 203,465 57,166,684 53,531,276 72,165,261 63.570,320 27 26 24,064,280 23,576,604 4,113,000 672,155 20,359.586 3.950.000 824.698 25,134.254 15.950.821 15,634,471 4113.000 1.267.009 20,359.586 3.950.000 1.456,052 Total current assets LIABILITIES Non-current liabilities Benrowings Lease liabilities Deferred taxation End of service benefits Total non-current liabilities Current liabilities Borrowings Lease liabilities Trade and other payables Short term borrowing Taxation 30 52,426,039 3678.31 25,765,638 27 6.905.179 6,945314 31 9,101,528 6,470,828 18,723,763 14,417,254 454,000 17,315,334 25,721,043 6.995.836 22,405,452 17.009.613 454.000 19,525.763 243.804 1,179,004 41 842.000 49,167,373 25.062,513 72.205.994 27.393.885 101,593,412 50,196,797 108.971.425 53.659.523 Total current liabilities Total abilities Total equity and liabilities Net assets per share 230,962,008 181.880.568 2540841,311 199,769.678 32 0.647 0.658 0.729 0.731 RAYSUT CEMENT COMPANY SAOG AND ITS SUBSIDIARIES Parent company and consolidated statement of profit or loss and other comprehensive income for the year ended 31 December 2019 Parent 2019 2018 RO RO 60.333.591 62.120.438 (47.220.834) (49.325.115) 13,113,057 12.795,323 (6.543,601) (4.552.177) (7,586,851) (6.940,111) 4.509,880 1,012.011 Consolidated 2019 2018 RO RO S4,055, 760 90.950.026 (64.991.186) (79.357.318) 35 19,064,574 (8,011.187) (8,477,523) 5.190.348 15.622.705 (7,081,012) (7.619,872) 1.781.592 38 Revenue Cost of sales Gross profit General and administrative expenses Selling and distribution expenses Other income Operating profit Finance cost-net Investment income Share of profit from an associate Impairment of investment in an associate Fair value loss on financial assets at fair value through profit or low Profit before tas Income tax 39 40 11 11 3,492,485 (4.143.163) 2.184,273 2.315,046 (1.038.257) 3.827,748 7,766,212 (4.235.568) 199,273 2.703,416 (1.044.15) 159,825 9.390 (234,759) 17 (612.900) 807,352 (622,527) (787.948) 4.316.589 (668.769) (612,900) 2.882.258 (622,527) (787948) 1.040.525 (696.873) 41 184.825 3.647.820 2,259,731 343.652 Total profit and comprehensive income for the year Total profit and comprehensive income attributable to: Owners of the parent company Non-controlling interest 184,825 3.647.820 2.259.731 343.801 (149) 184.825 3,647.820 2.259,731 343.652 Basie and diluted earnings per share 42 0.001 0.018 0.011 0.002 Formatting guideline: Worksheet font Type = Times of Roman Category=Number, Decimal places=2 and Use 1,000 separator Border the Statement is using Icone "All borders" Using the formula for calculation Column Width A = 60 / B,D,F&H=15 /C,E &G 0.50 Theme colors White Background1, Darker 25% Headings Main Heading Bold, Font Size 12, Sub Heading Bold Font Size 11, Theme colors White, Background1, Darker 25% Formula Use formula for all calculations Question 1. You are required to analyze the Parent company of Raysut Cement Company (S.A.O.G) financial statements (Statement of Financial Position and Statement of Revenue) for a period of 2018-2019 years, using the tools and techniques such as; Vertical Analysis. (10 Marks) RAYSUT CEMENT COMPANY SAOG AND ITS SUBSIDIARIES RAYSUT CEMENT COMPANY SAOG AND ITS SUBSIDIARIES Parent company and consolidated statement of financial position as at 31 December 2019 Parent Consolidated Notes 2019 2018 2019 2018 ASSETS RO RO RO RO Non-current assets Goodwill 46,617,068 45,798,586 Property, plant and equipment 64,153,295 61,469214 114,356,388 90,041,013 Right-of-use assets 29,050,726 21,577,594 Investment in an associate 113,343 234,759 Investment in subsidiaries 12 79,166,303 66,641,735 Receivable from a related party - non-current 18 1,300,000 Financial assets at fair value through other comprehensive income 125,000 125.000 125,000 125,000 Total non-current assets 173,795,324 128,349 292 182,676,050 136,199,358 Current assets Inventorics 15 26,619,382 22,608,689 32,764,017 29,003,393 Trade receivables - net 16 15,462,335 11,625,174 26,045,240 18,327,843 Advance to a subsidiary 13 849,000 2,834,000 Financial assets at fair value through profit or loss 17 2,616,102 3.229,002 2,616,102 3,229,002 Prepayments, advances and other receivables 18 11,416,400 7.441.570 9,757,438 6,558,951 Short term deposits 19 4.700.000 4,700,000 Cash and bank balances 20 203,465 1,092,841 1,751,131 Total current assets 57,166,684 53,531,276 72,165,261 63,570,320 LIABILITIES Non-current liabilities Borrowings 27 24,064,280 20,359,586 15,950,821 20,359,586 Lease liabilities 28 23,576,604 15,434,471 Deferred taxation 29 4,113,000 3.950,000 4,113,000 3,950,000 End of service benefits 30 672,155 824.698 1,267,139 1,456,052 Total non-current liabilities 52,426,039 25,134,284 36,765,431 25,765,638 Current liabilities Borrowings 27 9,101,528 6,905,179 25,721,093 6,945314 Lease liabilities 28 6,470,828 6,595,836 Trade and other payables 31 18,723,763 17,315,334 22,425,452 19.525.763 Short term borrowings 49 14,417,254 17,009,613 243,804 Taxation 41 454,000 842,000 454,000 1,179,004 Total current liabilities 49,167,373 25,062,513 72,205,994 27,893,885 Total liabilities 101,593,412 50,196,797 108,971,425 53,659,523 Total equity and liabilities 230,962,008 181,880,568 254,841,311 199,769,678 Net assets per share 32 0.647 0.658 0.729 0.731 982,464 RAYSUT CEMENT COMPANY SAOG AND ITS SUBSIDIARIES Parent company and consolidated statement of profit or loss and other comprehensive income for the year ended 31 December 2019 Parent Consolidated 2019 2018 2019 2018 RO RO RO Revenue 33 60,333,591 62.120,438 84,055,760 90.980,026 Cost of sales 34 (47,220,534) (49.325.115) (64,991,186) (75.357,318) Notes RO 35 37 38 13,113,057 12,795,323 (6,543,601) (4.552,177) (7,586,851) (6.940.111) 4,509,880 1,012.011 19,064,574 15.622.708 (8,011,187) (7.081,012) (8,477,523) (7.619.872) 5,190,348 1.781,592 Gross profit General and administrative expenses Selling and distribution expenses Other income Operating profit Finance cost - net Investment income Share of profit from an associate Impairment of investment in an associate Fair value loss on financial assets at fair value through profit or loss Profit before tax Income tax 39 40 11 11 3,492,485 2.315,046 (4,143,163) (1.038.257) 2,184,273 3.827,748 7,766,212 2.703,416 (4,235,568) (1.044,158) 199,273 159.825 9,390 (234,759) (113,343) (612,900) (787.948) (612,900) (787,948) 17 807,352 (622,527) 4.316.589 (668,769) 2,882,258 (622,527) 1.040,525 (696,873) 41 184,825 3,647,820 2,259,731 343,652 Total profit and comprehensive income for the year Total profit and comprehensive income attributable to: Owners of the parent company Non-controlling interest 184,825 3,647,820 2,259,731 343.801 (149) 184,825 3,647,820 2,259,731 343.652 Basic and diluted earnings per share 42 0.001 0.018 0.011 0.002 Formatting guideline: Worksheet font Type = Times of Roman Category=Number; Decimal places=2 and Use 1,000 separator Border the Statement is using I cone "All borders" Using the formula for calculation Column width A = 60 / B,D,F & H =15 /C,E&G 0.50 Theme colors White, Background1, Darker 25% Headings Main Heading Bold, Font Size 12, Sub Heading Bold Font Size 11, Theme colors White, Background1, Darker 25% Formula Use formula for all calculations Instruction: Answer all the questions. Each question carries five (10) marks. (5Q * 10M = 50 MARKS) Question 1. You are required to analyze the Parent company of Raysut Cement Company (S.A.O.G) financial statements (Statement of Financial Position and Statement of Revenue) for a period of 2018-2019 years, using the tools and techniques such as; Vertical Analysis. (10 Marks) RAYSUT CEMENT COMPANY SAOG AND ITS SUBSIDIARIES Parent company and consolidated statement of financial position as at 31 December 2019 6 Notes Parent 2019 RO 2018 RO Consolidated 2019 RO 2018 RO 46,617,068 114,356,388 21,577,594 9 10 11 12 18 61,469,214 113,343 66,641,735 45,798,586 90,041,013 234,759 ASSETS Non-current assets Goodwill Property, plant and equipment Right-of-use assets Investment in an associate Investment in subsidiaries Receivable from a related party - non-current Financial assets at fair value through other comprehensive income Total non-current assets Current assets Inventories Trade receivables - net Advance to a subsidiary Financial assets at fair value through profit or loss Prepayments, advances and other receivables Short term deposits Cash and bank balances Total current assets LIABILITIES 64,153,295 29,050,726 79,166,303 1,300,000 125,000 173,795,324 14 125,000 128,349,292 125,000 182,676,050 125,000 136,199,358 15 16 13 17 26,619,382 15,462,335 849,000 2,616,102 11,416,400 22,608,689 11.625,174 2,834,000 3,229,002 7.441,570 4,700,000 1,092,841 53,531,276 32,764,017 26,045,240 2,616,102 9,757,438 982,464 72,165,261 29,003,393 18,327,843 3,229,002 6,558,951 4,700,000 1,751,131 19 20 203,465 57,166,684 63,570,320 Non current liabilities 27 28 29 30 24,064,280 23,576,604 4,113,000 672,155 20,359,586 3.950,000 824,698 25,134,284 15,950,821 15,434,471 4,113,000 1,267,139 20,359,586 3.950,000 1.456,052 52,426,039 36,765,431 25,765,638 6,945,314 LIABILITIES Non-current liabilities Borrowings Lease liabilities Deferred taxation End of service benefits Total non-current liabilities Current liabilities Borrowings Lease liabilities Trade and other payables Short term borrowings Taxation Total current linbilities Total liabilities Total equity and liabilities Net assets per share 27 28 31 49 9,101,528 6,470,828 18,723,763 14,417,254 454,000 6,905,179 17,315,334 842,000 25,721,093 6,595,836 22,425,452 17,009,613 454,000 72,205,994 19,525,763 243,804 1,179,004 27,893,885 53,659,523 49,167,373 101,593,412 25,062,513 50,196,797 181,880,568 108,971,425 254,841,311 230,962,008 199,769,678 32 0.647 0.658 0.729 0.731 RAYSUT CEMENT COMPANY SAOG AND ITS SUBSIDIARIES Parent company and consolidated statement of profit or loss and other comprehensive income for the year ended 31 December 2019 Parent Consolidated Notes 2019 2018 2019 2018 RO RO RO RO Revenue 33 60,333,591 62,120,438 84,055,760 90.980.026 Cost of sales (47,220,534) (49.325.115) (64,991,186) (75,357,318) 34 Gross profit General and administrative expenses Selling and distribution expenses Other income 35 37 38 13,113,057 (6,543,601) (7,586,851) 4,509,880 12,795,323 (4.552,177) (6.940,111) 1,012.011 19,064,574 (8,011,187) (8,477,523) 5,190,348 15.622.708 (7,081,012) (7.619.872) 1.781,592 Operating profit Finance cost-net Investment income Share of profit from an associate Impairment of investment in an associate 3,492,485 (4,143,163) 2,184,273 2.315,046 (1,038,257) 3.827,748 7,766,212 (4,235,568) 199,273 39 40 11 11 2,703,416 (1,044,158) 159.825 9.390 (113,343) (234,759) (612,900) (787,948) (612,900) (787.948) 17 Fair value loss on financial assets at fair value through profit or loss Profit before tax Income tax 807,352 (622,527) 4.316,589 (668,769) 2,882,258 (622,527) 1.040.525 (696,873) 41 184,825 3,647.820 2,259,731 343.652 Total profit and comprehensive income for the year Total profit and comprehensive income attributable to: Owners of the parent company Non-controlling interest 184,825 3.647.820 2,259,731 343.801 (149) 184,825 3,647.820 2,259,731 343,652 Basic and diluted earnings per share 42 0.001 0.018 0.011 0.002 Formatting guideline: Worksheet font Type = Times of Roman Category=Number; Decimal places=2 and Use 1,000 separator Border the Statement is using I cone "All borders" Using the formula for calculation Column Width A = 60 / B,D,F&H=15 /C,E&G 0.50 Theme colors White, Background1, Darker 25% Headings Main Heading Bold, Font Size 12, Sub Heading Bold Font Size 11, Theme colors White, Background1, Darker 25% Formula Use formula for all calculations Question.5 (A) Hatem Al Kiyumi wishes to buy a car for an employee. He is looking for an economically priced car. He visited various showrooms as compared with a different brand, their offers, and schemes. He does not want to pay all the price at once, so he is looking for a down payment and installment payment schemes. He has a limited income for this reason he is trying to find a deal with easy installment payment and less interest rate so he can minimize the overall payment and he may get a preferred car under his budget. One day he visited Ford Motor showroom and found one suitable car as he wants to buy. The lease term period is for 5 years with the first payment due at the inception of the lease. The quoted annual interest rate is 6% per annual and he must make an additional down payment of OMR 4,500. The schemes also say that the residual value of the vehicle is OMR 5,000 payback after five years. After much research, he has concluded that, he could buy the car for a total price of OMR 30,500 (include first-year full insurance and Registration fees). Considering the over scenario and schemes calculate the monthly installment he will have to pay every month and prepare 5 years amortization schedule that shows the monthly principal and interest amount with the lease , beginning balance, scheduled payment, principal amount, ending balance, and cumulative interest. (6 Marks) B. Considering the above scenario, prepare 4 years deprecation schedule that shows the yearly deprecation expenses for five years and using the following deprecation functions. (4 Marks) a. Double-declining balance method function b. Sum-of-the-years'- digits method function C. Straight Line method function d. Fixed-declining balance method function. Instruction: Answer all the questions. Each question carries five (10) marks. (5Q10M = 50 MARKS) Question 1. You are required to analyze the Parent company of Raysut Cement Company (S.A.O.G) financial statements (Statement of Financial Position and Statement of Revenue) for a period of 2018-2019 years, using the tools and techniques such as; Vertical Analysis. (10 Marks) RAYSUT CEMENT COMPANY SAOG AND ITS SUBSIDIARIES Parent company and consolidated statement of financial position as at 31 December 2019 Parent Consolidated Notes 2019 RO 2013 RO RO 2018 RO 45,798,586 90,041,013 9 10 46,617068 114,156.188 21.577594 64,153,299 29,050,726 61.469214 113.343 66,641,735 234,759 12 18 79,166,303 1,300,000 14 125,000 125.000 125.000 125.000 ASSETS Non-current assets Goodwill Property, plant and equipment Right-of-use assets Investment in an associate Investment in subsidiaries Receivable from a related party - non-current Financial assets at fair value through other comprehensive income Total man-current assets Current Assets Inventories Trade receivables-net Advance to a subsidiary Financial assets at fair value through profit or loss Prepayments, advances and other receivables Short term deposits Cash and bank balaces 173.795.324 128.349,292 136,199.358 32,764017 26,045.240 29,003,393 18.327.843 15 16 13 19 18 19 20 26,619,382 15,462,335 849,000 2,616,102 11,416,400 22.608.589 11.625.174 2,834.000 3.229.002 7.461,570 4.700.000 1,092,841 2,616,102 9,757,435 3.229.002 6,358951 4.700.000 1.751,131 982,464 203,465 57,166,684 53,531,276 72,165,261 63.570,320 27 26 24,064,280 23,576,604 4,113,000 672,155 20,359.586 3.950.000 824.698 25,134.254 15.950.821 15,634,471 4113.000 1.267.009 20,359.586 3.950.000 1.456,052 Total current assets LIABILITIES Non-current liabilities Benrowings Lease liabilities Deferred taxation End of service benefits Total non-current liabilities Current liabilities Borrowings Lease liabilities Trade and other payables Short term borrowing Taxation 30 52,426,039 3678.31 25,765,638 27 6.905.179 6,945314 31 9,101,528 6,470,828 18,723,763 14,417,254 454,000 17,315,334 25,721,043 6.995.836 22,405,452 17.009.613 454.000 19,525.763 243.804 1,179,004 41 842.000 49,167,373 25.062,513 72.205.994 27.393.885 101,593,412 50,196,797 108.971.425 53.659.523 Total current liabilities Total abilities Total equity and liabilities Net assets per share 230,962,008 181.880.568 2540841,311 199,769.678 32 0.647 0.658 0.729 0.731 RAYSUT CEMENT COMPANY SAOG AND ITS SUBSIDIARIES Parent company and consolidated statement of profit or loss and other comprehensive income for the year ended 31 December 2019 Parent 2019 2018 RO RO 60.333.591 62.120.438 (47.220.834) (49.325.115) 13,113,057 12.795,323 (6.543,601) (4.552.177) (7,586,851) (6.940,111) 4.509,880 1,012.011 Consolidated 2019 2018 RO RO S4,055, 760 90.950.026 (64.991.186) (79.357.318) 35 19,064,574 (8,011.187) (8,477,523) 5.190.348 15.622.705 (7,081,012) (7.619,872) 1.781.592 38 Revenue Cost of sales Gross profit General and administrative expenses Selling and distribution expenses Other income Operating profit Finance cost-net Investment income Share of profit from an associate Impairment of investment in an associate Fair value loss on financial assets at fair value through profit or low Profit before tas Income tax 39 40 11 11 3,492,485 (4.143.163) 2.184,273 2.315,046 (1.038.257) 3.827,748 7,766,212 (4.235.568) 199,273 2.703,416 (1.044.15) 159,825 9.390 (234,759) 17 (612.900) 807,352 (622,527) (787.948) 4.316.589 (668.769) (612,900) 2.882.258 (622,527) (787948) 1.040.525 (696.873) 41 184.825 3.647.820 2,259,731 343.652 Total profit and comprehensive income for the year Total profit and comprehensive income attributable to: Owners of the parent company Non-controlling interest 184,825 3.647.820 2.259.731 343.801 (149) 184.825 3,647.820 2.259,731 343.652 Basie and diluted earnings per share 42 0.001 0.018 0.011 0.002 Formatting guideline: Worksheet font Type = Times of Roman Category=Number, Decimal places=2 and Use 1,000 separator Border the Statement is using Icone "All borders" Using the formula for calculation Column Width A = 60 / B,D,F&H=15 /C,E &G 0.50 Theme colors White Background1, Darker 25% Headings Main Heading Bold, Font Size 12, Sub Heading Bold Font Size 11, Theme colors White, Background1, Darker 25% Formula Use formula for all calculations Question 1. You are required to analyze the Parent company of Raysut Cement Company (S.A.O.G) financial statements (Statement of Financial Position and Statement of Revenue) for a period of 2018-2019 years, using the tools and techniques such as; Vertical Analysis. (10 Marks) RAYSUT CEMENT COMPANY SAOG AND ITS SUBSIDIARIES RAYSUT CEMENT COMPANY SAOG AND ITS SUBSIDIARIES Parent company and consolidated statement of financial position as at 31 December 2019 Parent Consolidated Notes 2019 2018 2019 2018 ASSETS RO RO RO RO Non-current assets Goodwill 46,617,068 45,798,586 Property, plant and equipment 64,153,295 61,469214 114,356,388 90,041,013 Right-of-use assets 29,050,726 21,577,594 Investment in an associate 113,343 234,759 Investment in subsidiaries 12 79,166,303 66,641,735 Receivable from a related party - non-current 18 1,300,000 Financial assets at fair value through other comprehensive income 125,000 125.000 125,000 125,000 Total non-current assets 173,795,324 128,349 292 182,676,050 136,199,358 Current assets Inventorics 15 26,619,382 22,608,689 32,764,017 29,003,393 Trade receivables - net 16 15,462,335 11,625,174 26,045,240 18,327,843 Advance to a subsidiary 13 849,000 2,834,000 Financial assets at fair value through profit or loss 17 2,616,102 3.229,002 2,616,102 3,229,002 Prepayments, advances and other receivables 18 11,416,400 7.441.570 9,757,438 6,558,951 Short term deposits 19 4.700.000 4,700,000 Cash and bank balances 20 203,465 1,092,841 1,751,131 Total current assets 57,166,684 53,531,276 72,165,261 63,570,320 LIABILITIES Non-current liabilities Borrowings 27 24,064,280 20,359,586 15,950,821 20,359,586 Lease liabilities 28 23,576,604 15,434,471 Deferred taxation 29 4,113,000 3.950,000 4,113,000 3,950,000 End of service benefits 30 672,155 824.698 1,267,139 1,456,052 Total non-current liabilities 52,426,039 25,134,284 36,765,431 25,765,638 Current liabilities Borrowings 27 9,101,528 6,905,179 25,721,093 6,945314 Lease liabilities 28 6,470,828 6,595,836 Trade and other payables 31 18,723,763 17,315,334 22,425,452 19.525.763 Short term borrowings 49 14,417,254 17,009,613 243,804 Taxation 41 454,000 842,000 454,000 1,179,004 Total current liabilities 49,167,373 25,062,513 72,205,994 27,893,885 Total liabilities 101,593,412 50,196,797 108,971,425 53,659,523 Total equity and liabilities 230,962,008 181,880,568 254,841,311 199,769,678 Net assets per share 32 0.647 0.658 0.729 0.731 982,464 RAYSUT CEMENT COMPANY SAOG AND ITS SUBSIDIARIES Parent company and consolidated statement of profit or loss and other comprehensive income for the year ended 31 December 2019 Parent Consolidated 2019 2018 2019 2018 RO RO RO Revenue 33 60,333,591 62.120,438 84,055,760 90.980,026 Cost of sales 34 (47,220,534) (49.325.115) (64,991,186) (75.357,318) Notes RO 35 37 38 13,113,057 12,795,323 (6,543,601) (4.552,177) (7,586,851) (6.940.111) 4,509,880 1,012.011 19,064,574 15.622.708 (8,011,187) (7.081,012) (8,477,523) (7.619.872) 5,190,348 1.781,592 Gross profit General and administrative expenses Selling and distribution expenses Other income Operating profit Finance cost - net Investment income Share of profit from an associate Impairment of investment in an associate Fair value loss on financial assets at fair value through profit or loss Profit before tax Income tax 39 40 11 11 3,492,485 2.315,046 (4,143,163) (1.038.257) 2,184,273 3.827,748 7,766,212 2.703,416 (4,235,568) (1.044,158) 199,273 159.825 9,390 (234,759) (113,343) (612,900) (787.948) (612,900) (787,948) 17 807,352 (622,527) 4.316.589 (668,769) 2,882,258 (622,527) 1.040,525 (696,873) 41 184,825 3,647,820 2,259,731 343,652 Total profit and comprehensive income for the year Total profit and comprehensive income attributable to: Owners of the parent company Non-controlling interest 184,825 3,647,820 2,259,731 343.801 (149) 184,825 3,647,820 2,259,731 343.652 Basic and diluted earnings per share 42 0.001 0.018 0.011 0.002 Formatting guideline: Worksheet font Type = Times of Roman Category=Number; Decimal places=2 and Use 1,000 separator Border the Statement is using I cone "All borders" Using the formula for calculation Column width A = 60 / B,D,F & H =15 /C,E&G 0.50 Theme colors White, Background1, Darker 25% Headings Main Heading Bold, Font Size 12, Sub Heading Bold Font Size 11, Theme colors White, Background1, Darker 25% Formula Use formula for all calculations Instruction: Answer all the questions. Each question carries five (10) marks. (5Q * 10M = 50 MARKS) Question 1. You are required to analyze the Parent company of Raysut Cement Company (S.A.O.G) financial statements (Statement of Financial Position and Statement of Revenue) for a period of 2018-2019 years, using the tools and techniques such as; Vertical Analysis. (10 Marks) RAYSUT CEMENT COMPANY SAOG AND ITS SUBSIDIARIES Parent company and consolidated statement of financial position as at 31 December 2019 6 Notes Parent 2019 RO 2018 RO Consolidated 2019 RO 2018 RO 46,617,068 114,356,388 21,577,594 9 10 11 12 18 61,469,214 113,343 66,641,735 45,798,586 90,041,013 234,759 ASSETS Non-current assets Goodwill Property, plant and equipment Right-of-use assets Investment in an associate Investment in subsidiaries Receivable from a related party - non-current Financial assets at fair value through other comprehensive income Total non-current assets Current assets Inventories Trade receivables - net Advance to a subsidiary Financial assets at fair value through profit or loss Prepayments, advances and other receivables Short term deposits Cash and bank balances Total current assets LIABILITIES 64,153,295 29,050,726 79,166,303 1,300,000 125,000 173,795,324 14 125,000 128,349,292 125,000 182,676,050 125,000 136,199,358 15 16 13 17 26,619,382 15,462,335 849,000 2,616,102 11,416,400 22,608,689 11.625,174 2,834,000 3,229,002 7.441,570 4,700,000 1,092,841 53,531,276 32,764,017 26,045,240 2,616,102 9,757,438 982,464 72,165,261 29,003,393 18,327,843 3,229,002 6,558,951 4,700,000 1,751,131 19 20 203,465 57,166,684 63,570,320 Non current liabilities 27 28 29 30 24,064,280 23,576,604 4,113,000 672,155 20,359,586 3.950,000 824,698 25,134,284 15,950,821 15,434,471 4,113,000 1,267,139 20,359,586 3.950,000 1.456,052 52,426,039 36,765,431 25,765,638 6,945,314 LIABILITIES Non-current liabilities Borrowings Lease liabilities Deferred taxation End of service benefits Total non-current liabilities Current liabilities Borrowings Lease liabilities Trade and other payables Short term borrowings Taxation Total current linbilities Total liabilities Total equity and liabilities Net assets per share 27 28 31 49 9,101,528 6,470,828 18,723,763 14,417,254 454,000 6,905,179 17,315,334 842,000 25,721,093 6,595,836 22,425,452 17,009,613 454,000 72,205,994 19,525,763 243,804 1,179,004 27,893,885 53,659,523 49,167,373 101,593,412 25,062,513 50,196,797 181,880,568 108,971,425 254,841,311 230,962,008 199,769,678 32 0.647 0.658 0.729 0.731 RAYSUT CEMENT COMPANY SAOG AND ITS SUBSIDIARIES Parent company and consolidated statement of profit or loss and other comprehensive income for the year ended 31 December 2019 Parent Consolidated Notes 2019 2018 2019 2018 RO RO RO RO Revenue 33 60,333,591 62,120,438 84,055,760 90.980.026 Cost of sales (47,220,534) (49.325.115) (64,991,186) (75,357,318) 34 Gross profit General and administrative expenses Selling and distribution expenses Other income 35 37 38 13,113,057 (6,543,601) (7,586,851) 4,509,880 12,795,323 (4.552,177) (6.940,111) 1,012.011 19,064,574 (8,011,187) (8,477,523) 5,190,348 15.622.708 (7,081,012) (7.619.872) 1.781,592 Operating profit Finance cost-net Investment income Share of profit from an associate Impairment of investment in an associate 3,492,485 (4,143,163) 2,184,273 2.315,046 (1,038,257) 3.827,748 7,766,212 (4,235,568) 199,273 39 40 11 11 2,703,416 (1,044,158) 159.825 9.390 (113,343) (234,759) (612,900) (787,948) (612,900) (787.948) 17 Fair value loss on financial assets at fair value through profit or loss Profit before tax Income tax 807,352 (622,527) 4.316,589 (668,769) 2,882,258 (622,527) 1.040.525 (696,873) 41 184,825 3,647.820 2,259,731 343.652 Total profit and comprehensive income for the year Total profit and comprehensive income attributable to: Owners of the parent company Non-controlling interest 184,825 3.647.820 2,259,731 343.801 (149) 184,825 3,647.820 2,259,731 343,652 Basic and diluted earnings per share 42 0.001 0.018 0.011 0.002 Formatting guideline: Worksheet font Type = Times of Roman Category=Number; Decimal places=2 and Use 1,000 separator Border the Statement is using I cone "All borders" Using the formula for calculation Column Width A = 60 / B,D,F&H=15 /C,E&G 0.50 Theme colors White, Background1, Darker 25% Headings Main Heading Bold, Font Size 12, Sub Heading Bold Font Size 11, Theme colors White, Background1, Darker 25% Formula Use formula for all calculations Question.5 (A) Hatem Al Kiyumi wishes to buy a car for an employee. He is looking for an economically priced car. He visited various showrooms as compared with a different brand, their offers, and schemes. He does not want to pay all the price at once, so he is looking for a down payment and installment payment schemes. He has a limited income for this reason he is trying to find a deal with easy installment payment and less interest rate so he can minimize the overall payment and he may get a preferred car under his budget. One day he visited Ford Motor showroom and found one suitable car as he wants to buy. The lease term period is for 5 years with the first payment due at the inception of the lease. The quoted annual interest rate is 6% per annual and he must make an additional down payment of OMR 4,500. The schemes also say that the residual value of the vehicle is OMR 5,000 payback after five years. After much research, he has concluded that, he could buy the car for a total price of OMR 30,500 (include first-year full insurance and Registration fees). Considering the over scenario and schemes calculate the monthly installment he will have to pay every month and prepare 5 years amortization schedule that shows the monthly principal and interest amount with the lease , beginning balance, scheduled payment, principal amount, ending balance, and cumulative interest. (6 Marks) B. Considering the above scenario, prepare 4 years deprecation schedule that shows the yearly deprecation expenses for five years and using the following deprecation functions. (4 Marks) a. Double-declining balance method function b. Sum-of-the-years'- digits method function C. Straight Line method function d. Fixed-declining balance method function
