Answered step by step
Verified Expert Solution
Question
1 Approved Answer
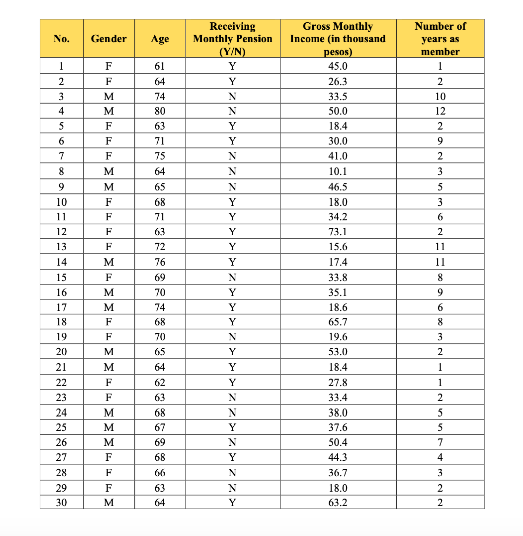
Instruction: As a rookie researcher, you are to describe the given data on the table below. It shows the Personal Data of the 30 members
Instruction: As a rookie researcher, you are to describe the given data on the table below. It shows the Personal Data of the 30 members of the Senior Citizens Association. Follow the directions stated:
1. Choose a quantitative variable from the given data set. 2. Need a quantitative frequency distribution table. 3. Solve for the Measures of Central Tendency and Variability. 4. Need a histogram for the given data. 5. An interpretation based on the given result of descriptive measures.

Step by Step Solution
There are 3 Steps involved in it
Step: 1

Get Instant Access to Expert-Tailored Solutions
See step-by-step solutions with expert insights and AI powered tools for academic success
Step: 2

Step: 3

Ace Your Homework with AI
Get the answers you need in no time with our AI-driven, step-by-step assistance
Get Started


