Answered step by step
Verified Expert Solution
Link Copied!

Question

1 Approved Answer

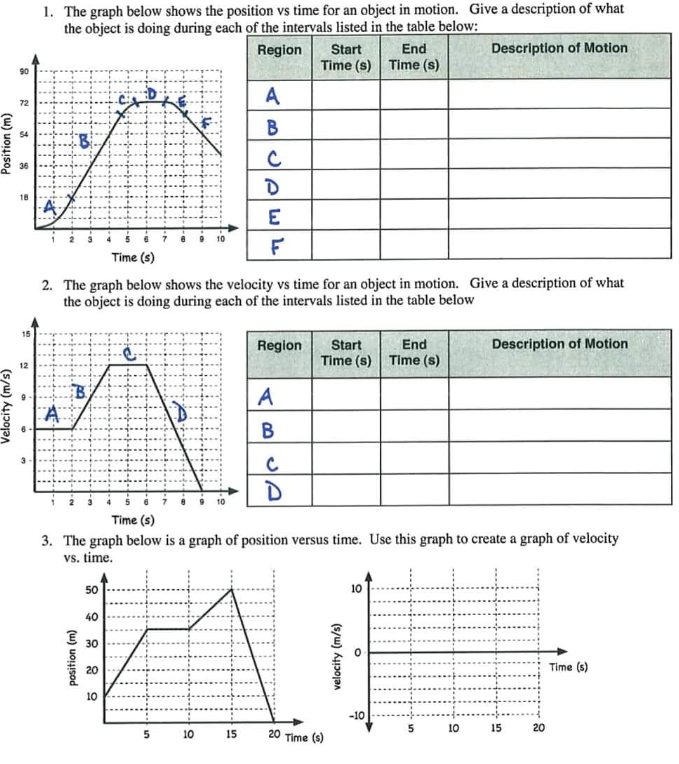
Instruction: I need a tutor who can answer this correctly. Show your solutions. 1. The graph below shows the position vs time for an object

Instruction: I need a tutor who can answer this correctly. Show your solutions.

image text in transcribed
1. The graph below shows the position vs time for an object in motion. Give a description of what the object is doing during each of the intervals listed in the table below: Region Start End Description of Motion Time (s) Time (S) A B Position (m) C D E F Time (s) 2. The graph below shows the velocity vs time for an object in motion. Give a description of what the object is doing during each of the intervals listed in the table below 15 Region Start End Description of Motion 12 Time (s) Time (s) A Velocity (m/s) B D Time (s) 3. The graph below is a graph of position versus time. Use this graph to create a graph of velocity vs. time. 50 10 40 30 velocity (m/s) position (m) 20 Time (s) 10 -10 10 15 20 10 15 20 Time (s)

Step by Step Solution

There are 3 Steps involved in it

Step: 1

blur-text-image

Get Instant Access to Expert-Tailored Solutions

See step-by-step solutions with expert insights and AI powered tools for academic success

Step: 2

blur-text-image

Step: 3

blur-text-image

Ace Your Homework with AI

Get the answers you need in no time with our AI-driven, step-by-step assistance

Get Started

Recommended Textbook for

Fundamentals of Physics

Authors: Jearl Walker, Halliday Resnick

9th Edition

470469080, 470556536, 470469110, 9780470469088, 9780470556535, 978-0470469118

More Books

Students also viewed these Physics questions