Answered step by step
Verified Expert Solution
Question
1 Approved Answer
Instruction: Please read the following instruction before you start your homework For short-answer questions, you need to show the instructor your work. When working


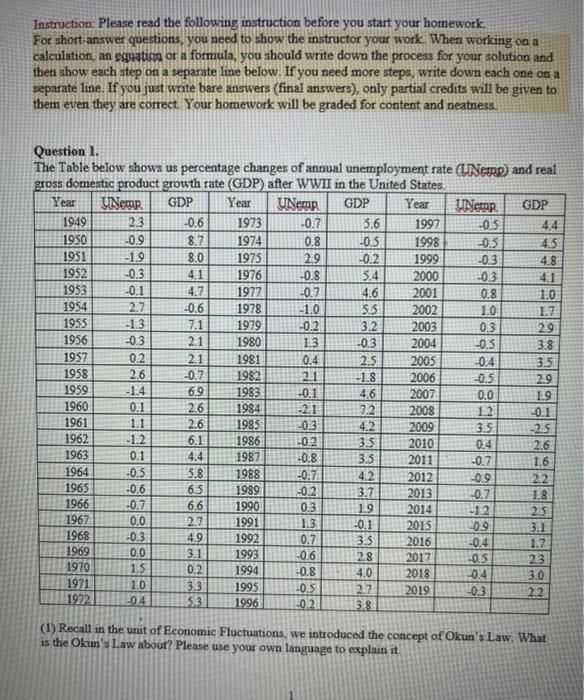
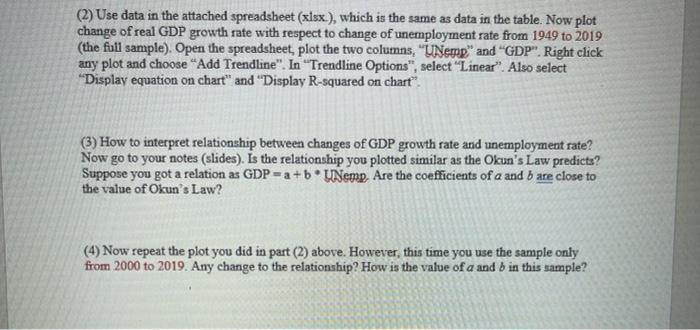
Instruction: Please read the following instruction before you start your homework For short-answer questions, you need to show the instructor your work. When working on a calculation, an eguation or a formula, you should write down the process for your solution and then show each step on a separate line below. If you need more steps, write down each one on a separate line. Ifyou just write bare answers (final answers), only partial credits will be given to them even they are correct Your homework will be graded for content and neatness. Question 1. The Table below shows us percentage changes of annual unemployment rate (UNemp) and real gross domestic product growth rate (GDP) after WWII in the United States. Year UNeup GDP Year UNemp GDP Year UNeup 1997 GDP 1949 2.3 -0.6 1973 0.7 5.6 0.5 4.4 1950 -0.9 8.7 1974 0.8 -0.5 1998 0.5 4.5 1951 -1.9 8.0 1975 2.9 0.2 1999 0.3 4.8 1952 -0.3 4.1 1976 -0.8 5.4 2000 -0.3 4.1 1953 0.1 4.7 1977 -0.7 4.6 2001 0.8 1.0 1954 2.7 -0.6 1978 -1.0 5.5 2002 2003 1.0 17 1955 -1.3 7.1 1979 -0.2 3.2 0.3 29 1956 -0.3 2.1 1980 13 0.3 2004 0.5 3.8 1957 0.2 2.1 1981 0.4 2.5 2005 2006 -0.4 3.5 1958 2.6 -0.7 1982 2.1 -1.8 -0.5 0.0 2.9 1959 -1.4 6.9 1983 -0.1 2.1 4.6 2007 19 1960 0.1 1.1 -1.2 2.6 1984 7.2 2008 12 0.1 -25 1961 2.6 1985 -0.3 0.2 4.2 2009 3.5 1962 6.1 1986 3.5 2010 0.4 2.6 1.6 1963 0.1 4.4 1987 -0.8 3.5 2011 0.7 5.8 6.5 6.6 1964 -0.5 1988 0.7 4.2 2012 0.9 2.2 1965 -0.6 1989 -0.2 3.7 2013 -0.7 18 1966 0.7 1990 1991 1992 1993 0.3 1.9 2014 -1.2 -0.9 2.5 1967 1968 0.0 2.7 1.3 -0.1 2015 3.1 -0.3 4.9 3.1 0.2 0.7 0.6 3.5 2.8 2016 1969 1970 0.4 -0.5 1.7 2.3 0.0 2017 2018 1.5 1994 -0.8 4.0 -0.4 3.0 1971 1972 1.0 3.3 1995 -0.5 2.7 2019 -0.3 22 04 5.3 1996 L0.2 3.8 (1) Recall in the unit of Economic Fluctuations, we introduced the concept of Okun's Law. What is the Okun's Law about? Please use your own language to explain it lalolol (2) Use data in the attached spreadsheet (xlsx.), which is the same as data in the table. Now plot change of real GDP growth rate with respect to change of unemployment rate from 1949 to 2019 (the full sample). Open the spreadsheet, plot the two columns, "UNemp" and "GDP". Right click any plot and choose "Add Trendline". In "Trendline Options", select "Linear". Also select "Display equation on chart" and "Display R-squared on chart". (3) How to interpret relationship between changes of GDP growth rate and unemployment rate? Now go to your notes (slides). Is the relationship you plotted similar as the Okun's Law predicts? Suppose you got a relation as GDP =a+b UNemp, Are the coefficients of a and b are close to the value of Okun's Law? (4) Now repeat the plot you did in part (2) above. However, this time you use the sample only from 2000 to 2019. Any change to the relationship? How is the value of a and b in this sample?
Step by Step Solution
★★★★★
3.50 Rating (147 Votes )
There are 3 Steps involved in it
Step: 1

Get Instant Access to Expert-Tailored Solutions
See step-by-step solutions with expert insights and AI powered tools for academic success
Step: 2

Step: 3

Ace Your Homework with AI
Get the answers you need in no time with our AI-driven, step-by-step assistance
Get Started


