Question: Instructions 1. For this assignment, we will begin the process of selecting the correct tool or Excel function to answer a question. 1a. Create

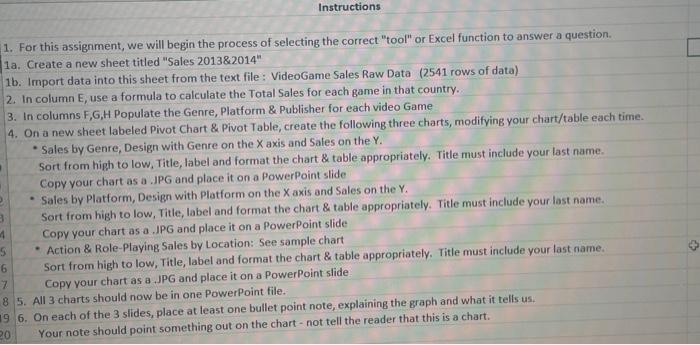
Instructions 1. For this assignment, we will begin the process of selecting the correct "tool" or Excel function to answer a question. 1a. Create a new sheet titled "Sales 2013&2014" 1b. Import data into this sheet from the text file: VideoGame Sales Raw Data (2541 rows of data) 2. In column E, use a formula to calculate the Total Sales for each game in that country.. 3. In columns F,G,H Populate the Genre, Platform & Publisher for each video Game 4. On a new sheet labeled Pivot Chart & Pivot Table, create the following three charts, modifying your chart/table each time. * Sales by Genre, Design with Genre on the X axis and Sales on the Y. Sort from high to low, Title, label and format the chart & table appropriately. Title must include your last name. Copy your chart as a .JPG and place it on a PowerPoint slide 3 4 5 6 Sales by Platform, Design with Platform on the X axis and Sales on the Y. Sort from high to low, Title, label and format the chart & table appropriately. Title must include your last name. Copy your chart as a .JPG and place it on a PowerPoint slide Action & Role-Playing Sales by Location: See sample chart Sort from high to low, Title, label and format the chart & table appropriately. Title must include your last name. Copy your chart as a .JPG and place it on a PowerPoint slide 7 8 5. All 3 charts should now be in one PowerPoint file. 19 6. On each of the 3 slides, place at least one bullet point note, explaining the graph and what it tells us. Your note should point something out on the chart- not tell the reader that this is a chart. 20
Step by Step Solution
3.46 Rating (156 Votes )
There are 3 Steps involved in it
Solutions Step 1 To complete this assignment follow these steps Create a new sheet titled Sales 20132014 and import the data Create a new sheet in Excel and title it Sales 20132014 Click the Data tab ... View full answer

Get step-by-step solutions from verified subject matter experts


