

Question
Instructions A titration was performed with 50.0 mL of 0.100 Mstrong acid (HCl (aq) ) titrated with 0.100 M of strong base (NaOH (aq) ).
| Instructions | |
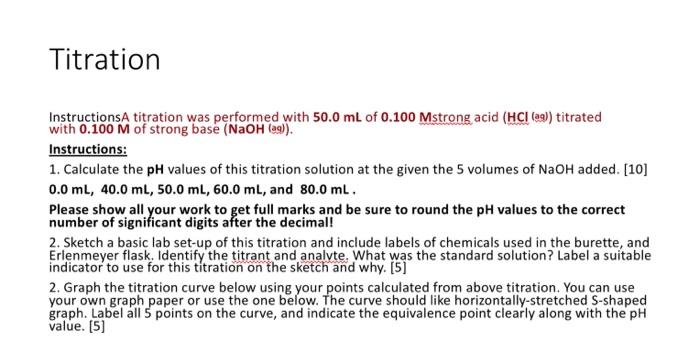
A titration was performed with 50.0 mL of 0.100 Mstrong acid (HCl (aq)) titrated with 0.100 M of strong base (NaOH (aq)). Instructions: 1. Calculate the pH values of this titration solution at the given the 5 volumes of NaOH added. [10] 0.0 mL, 40.0 mL, 50.0 mL, 60.0 mL, and 80.0 mL . Please show all your work to get full marks and be sure to round the pH values to the correct number of significant digits after the decimal! 2. Sketch a basic lab set-up of this titration and include labels of chemicals used in the burette, and Erlenmeyer flask. Identify the titrant and analyte. What was the standard solution? Label a suitable indicator to use for this titration on the sketch and why. [5] 2. Graph the titration curve below using your points calculated from above titration. You can use your own graph paper or use the one below. The curve should like horizontally-stretched S-shaped graph. Label all 5 points on the curve, and indicate the equivalence point clearly along with the pH value. [5] | |
Step by Step Solution
There are 3 Steps involved in it
Step: 1

Get Instant Access to Expert-Tailored Solutions
See step-by-step solutions with expert insights and AI powered tools for academic success
Step: 2

Step: 3
Ace Your Homework with AI
Get the answers you need in no time with our AI-driven, step-by-step assistance
Get Started
Public Finance
Authors: Harvey S. Rosen
5th Edition
025617329X, 978-0256173291