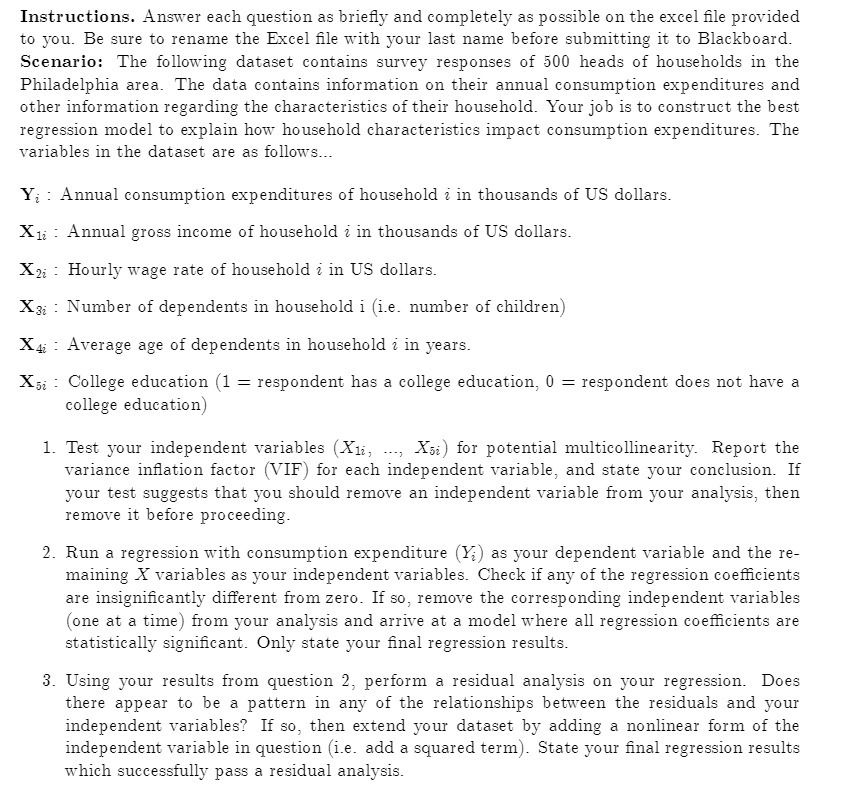
Instructions. Answer each question as briefly and completely as possible on the excel file provided to you. Be sure to rename the Excel file with your last name before submitting it to Blackboard. Scenario: The following dataset contains survey responses of 500 heads of households in the Philadelphia area. The data contains information on their annual consumption expenditures and other information regarding the characteristics of their household. Your job is to construct the best regression model to explain how household characteristics impact consumption expenditures. The variables in the dataset are as follows... Yo : Annual consumption expenditures of household i in thousands of US dollars. X1i : Annual gross income of household i in thousands of US dollars. X2 : Hourly wage rate of household i in US dollars. Xai : Number of dependents in household i (i.e. number of children) X47 : Average age of dependents in household i in years. Xsi : College education (1 = respondent has a college education, 0 = respondent does not have a college education) 1. Test your independent variables (Xli, ..., Xsi) for potential multicollinearity. Report the variance inflation factor (VIF) for each independent variable, and state your conclusion. If your test suggests that you should remove an independent variable from your analysis, then remove it before proceeding. 2. Run a regression with consumption expenditure (Y;) as your dependent variable and the re- maining X variables as your independent variables. Check if any of the regression coefficients are insignificantly different from zero. If so, remove the corresponding independent variables (one at a time) from your analysis and arrive at a model where all regression coefficients are statistically significant. Only state your final regression results. 3. Using your results from question 2, perform a residual analysis on your regression. Does there appear to be a pattern in any of the relationships between the residuals and your independent variables? If so, then extend your dataset by adding a nonlinear form of the independent variable in question (i.e. add a squared term). State your final regression results which successfully pass a residual analysis


