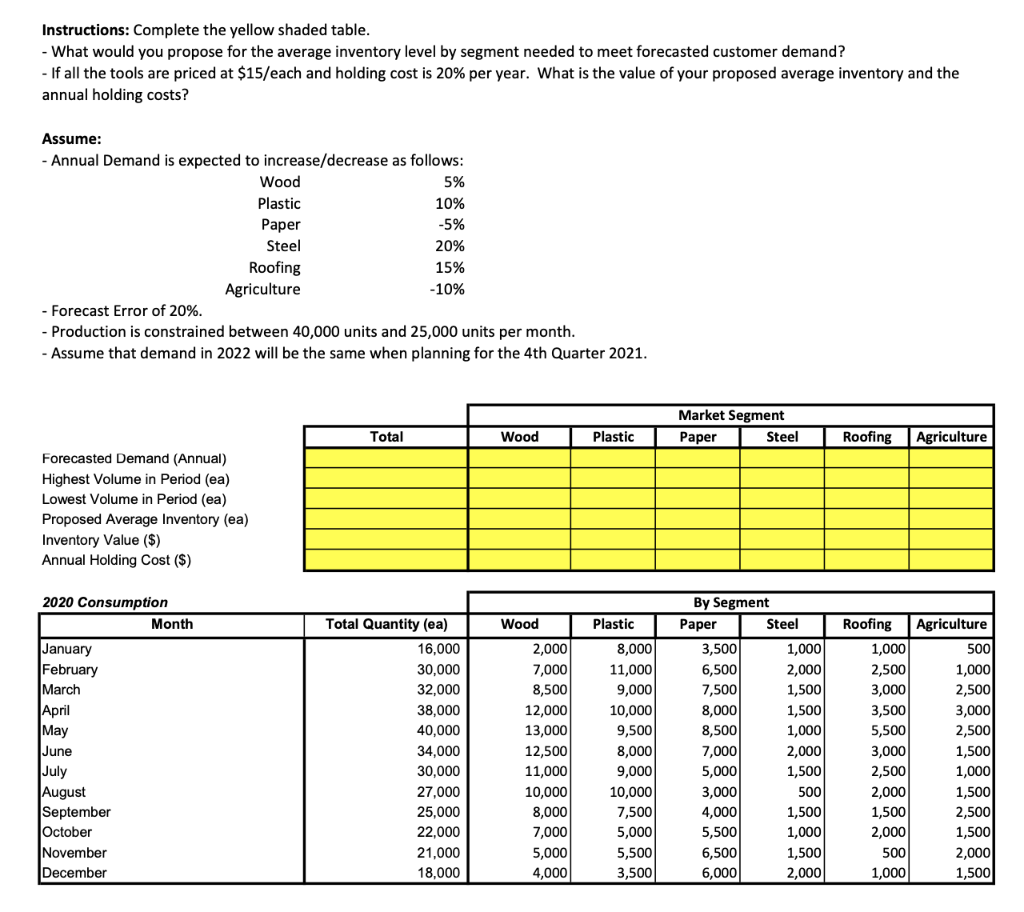
Instructions: Complete the yellow shaded table. - What would you propose for the average inventory level by segment needed to meet forecasted customer demand? - If all the tools are priced at $15/each and holding cost is 20% per year. What is the value of your proposed average inventory and the annual holding costs? Assume: - Annual Demand is expected to increase/decrease as follows: Wood 5% Plastic 10% Paper -5% Steel 20% Roofing 15% Agriculture -10% - Forecast Error of 20%. - Production is constrained between 40,000 units and 25,000 units per month. - Assume that demand in 2022 will be the same when planning for the 4th Quarter 2021. Market Segment Paper Steel Total Wood Plastic Roofing Agriculture Forecasted Demand (Annual) Highest Volume in Period (ea) Lowest Volume in Period (ea) Proposed Average Inventory (ea) Inventory Value ($) Annual Holding Cost ($) 2020 Consumption Month Wood Plastic January February March April May June July August September October November December Total Quantity (ea) 16,000 30,000 32,000 38,000 40,000 34,000 30,000 27,000 25,000 22,000 21,000 18,000 2,000 7,000 8,500 12,000 13,000 12,500 11,000 10,000 8,000 7,000 5,000 4,000 8,000 11,000 9,000 10,000 9,500 8,000 9,000 10,000 7,500 5,000 5,500 3,500 By Segment Paper Steel 3,500 1,000 6,500 2,000 7,500 1,500 8,000 1,500 8,500 1,000 7,000 2,000 5,000 1,500 3,000 500 4,000 1,500 5,500 1,000 6,500 1,500 6,000 2,000 Roofing 1,000 2,500 3,000 3,500 5,500 3,000 2,500 2,000 1,500 2,000 500 1,000 Agriculture 500 1,000 2,500 3,000 2,500 1,500 1,000 1,500 2,500 1,500 2,000 1,500 Instructions: Complete the yellow shaded table. - What would you propose for the average inventory level by segment needed to meet forecasted customer demand? - If all the tools are priced at $15/each and holding cost is 20% per year. What is the value of your proposed average inventory and the annual holding costs? Assume: - Annual Demand is expected to increase/decrease as follows: Wood 5% Plastic 10% Paper -5% Steel 20% Roofing 15% Agriculture -10% - Forecast Error of 20%. - Production is constrained between 40,000 units and 25,000 units per month. - Assume that demand in 2022 will be the same when planning for the 4th Quarter 2021. Market Segment Paper Steel Total Wood Plastic Roofing Agriculture Forecasted Demand (Annual) Highest Volume in Period (ea) Lowest Volume in Period (ea) Proposed Average Inventory (ea) Inventory Value ($) Annual Holding Cost ($) 2020 Consumption Month Wood Plastic January February March April May June July August September October November December Total Quantity (ea) 16,000 30,000 32,000 38,000 40,000 34,000 30,000 27,000 25,000 22,000 21,000 18,000 2,000 7,000 8,500 12,000 13,000 12,500 11,000 10,000 8,000 7,000 5,000 4,000 8,000 11,000 9,000 10,000 9,500 8,000 9,000 10,000 7,500 5,000 5,500 3,500 By Segment Paper Steel 3,500 1,000 6,500 2,000 7,500 1,500 8,000 1,500 8,500 1,000 7,000 2,000 5,000 1,500 3,000 500 4,000 1,500 5,500 1,000 6,500 1,500 6,000 2,000 Roofing 1,000 2,500 3,000 3,500 5,500 3,000 2,500 2,000 1,500 2,000 500 1,000 Agriculture 500 1,000 2,500 3,000 2,500 1,500 1,000 1,500 2,500 1,500 2,000 1,500