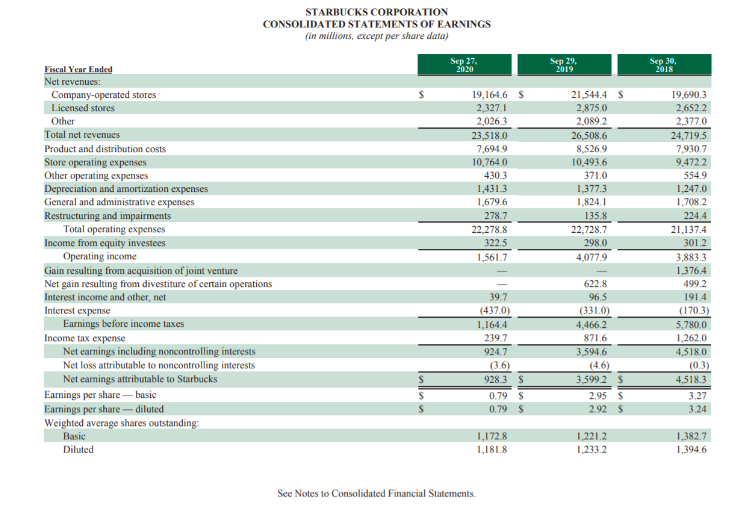
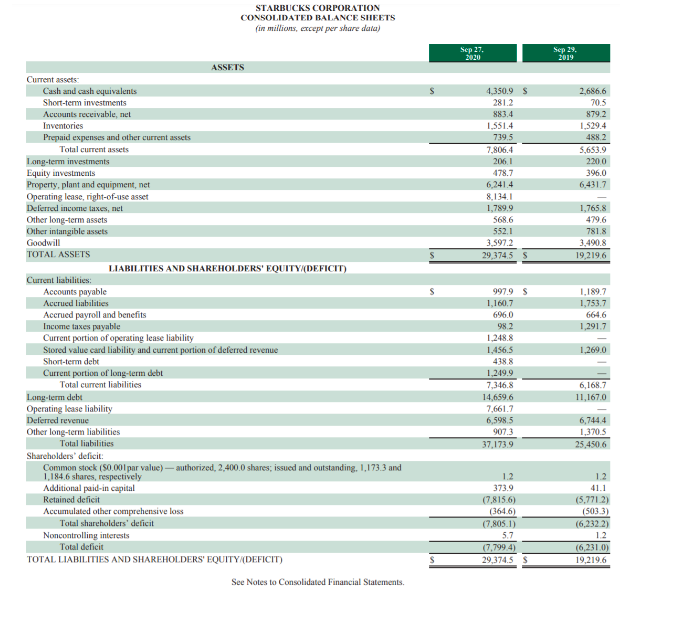
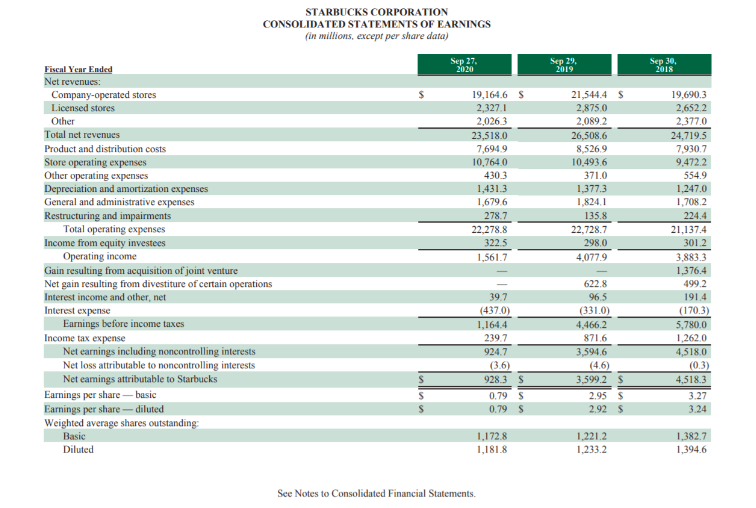
Instructions For this project, you will use the provided financial statements for Starbucks. Take 2019 and 2020 information given and perform the required financial ratios listed below. Compare the ratios of 2019 and 2020 to each other. In comparing the ratios you will need to discuss which year has a better ratio, justify your rationale, and explain your findings in detail in your analysis. Write at least one paragraph discussing your results for each ratio. You can do the assignment directly in this document by editing it and filling out the information then uploading it to Canvas, you may print this document and fill it out by hand and scan it and upload it to Canvas, or take pictures of the completed project with your cell phone and upload it to Canvas. Part 1: 1) What is the ratio used for, what is its purpose? 2) Write out formula 3) Fill out formula using the two years financial statement information for both companies 4) Your interpretation of ratio in at least one paragraph Part 2: For each of the four categories of ratios, identify what the four categories are, and in your own words, explain the following 1) Who are the main stakeholders? 2) What are they assessing? 3) Why are they assessing it?


STARBUCKS CORPORATION CONSOLIDATED STATEMENTS OF EARNINGS (in millions, except per share data) Sep 27, 2020 Sep 29, 2019 Sep 30, 2018 Fiscal Year Ended Net revenues. Company-operated stores Licensed stores Other Total net revenues Product and distribution costs Store operating expenses Other operating expenses Depreciation and amortization expenses General and administrative expenses Restructuring and impairments Total operating expenses Income from equity investees Operating income Gain resulting from acquisition of joint venture Net gain resulting from divestiture of certain operations Interest income and other, net Interest expense Earnings before income taxes Income tax expense Net earnings including noncontrolling interests Net loss attributable to noncontrolling interests Net eamings attributable to Starbucks Earnings per share-basic Earnings per share -- diluted Weighted average shares outstanding Basic Diluted 19,164.6 $ 2,327.1 2,0263 23,518.0 7,6949 10,764.0 430.3 1,431.3 1,6796 278.7 22,278.8 322.5 1,561.7 21,544.4 S 2,875.0 2,0892 26,508.6 8.5269 10.493.6 371.0 1,377.3 1,824.1 135.8 22,728.7 298.0 4,077.9 19,690.3 2.6522 2,377.0 24,719.5 7930.7 9.472.2 5549 1,247.0 1,7082 224.4 21,137.4 3012 3.883.3 1,376.4 499.2 1914 (170.3) 5,780.0 1,2620 4,518.0 (0.3) 4,518.3 3.27 3.24 397 (437.0) 1,164.4 239.7 924.7 (3.6) 9283 S 0.79 S 0.79 S 622.8 96.5 (331.0) 4,466.2 871.6 3,594.6 (4.6) 3,599.2 2.95 $ 2.92 $ 1.172.8 1,181.8 1.221.2 1,233.2 1,382.7 1,394,6 See Notes to Consolidated Financial Statements. STARBUCKS CORPORATION CONSOLIDATED BALANCE SHEETS (in millions, cep per share data) Sep 27. 2020 Sep 29. 2019 4.350,9 s 281.2 883.4 1.551.4 7395 7.806.4 2061 478.7 6,241.4 8,134.1 1,789.9 5686 552.1 3.597.2 29 3745 S 2,686.6 70.5 8792 1,529.4 4882 5,653.9 2200 396.0 6,431.7 1,765.8 479.6 781.8 3.490.8 19,219.6 S ASSETS Current assets Cash and cash equivalents Short-term investments Accounts receivable, net Inventories Prepaid expenses and other current assets Total current assets Long-term investments Equity investments Property, plant and equipment, net Operating lease, right-of-use asset Deferred income taxes, nel Other long-term assets Other intangible assets Goodwill TOTAL ASSETS LIABILITIES AND SHAREHOLDERS' EQUITY/(DEFICIT) Current liabilities: Accounts payable Accrued liabilities Accrued payroll and benefits Income taxes payable Current portion of operating lease liability Stored value card liability and current portion of deferred revenue Short-term debe Current portion of long-term debt Total current liabilities Long term debt Operating lease liability Deferred revenue Other long-term liabilities Total liabilities Shareholders' delicit Common stock (50.001 par value) - authorized, 2,400.0 shares; issued and outstanding. 1,173.3 and 1,1846 shares, respectively Additional paid-in capital Retained deficit Accumulated other comprehensive loss Total shareholders' deficit Noncontrolling interests Total deficit TOTAL LIABILITIES AND SHAREHOLDERS' EQUITY DEFICIT) 1.1897 1,753.7 6646 1,291.7 1,269.0 9979 $ 1,160,7 696.0 982 1.248.8 1.456.5 438 1.249.9 7,346.8 14,659.6 7.661.7 6,598,5 9073 37.173.9 6,168.7 11,167.0 6,7444 1,370.5 25.450.6 1.2 373.9 (7.8156) (3646) (7.805.1) 5.7 (7.7994) 29,374.5 S 1.2 41.1 (5,7712) (5033) (6.232.2) 12 (6,231.0) 19,219.6 See Notes to Consolidated Financial Statements. STARBUCKS CORPORATION CONSOLIDATED STATEMENTS OF EARNINGS (in millions, except per share data) Sep 27, 2020 Sep 29, 2019 Sep 30, 2018 Fiscal Year Ended Net revenues. Company-operated stores Licensed stores Other Total net revenues Product and distribution costs Store operating expenses Other operating expenses Depreciation and amortization expenses General and administrative expenses Restructuring and impairments Total operating expenses Income from equity investees Operating income Gain resulting from acquisition of joint venture Net gain resulting from divestiture of certain operations Interest income and other, net Interest expense Earnings before income taxes Income tax expense Net earnings including noncontrolling interests Net loss attributable to noncontrolling interests Net eamings attributable to Starbucks Earnings per share-basic Earnings per share -- diluted Weighted average shares outstanding Basic Diluted 19,164.6 $ 2,327.1 2,0263 23,518.0 7,6949 10,764.0 430.3 1,431.3 1,6796 278.7 22,278.8 322.5 1,561.7 21,544.4 S 2,875.0 2,0892 26,508.6 8.5269 10.493.6 371.0 1,377.3 1,824.1 135.8 22,728.7 298.0 4,077.9 19,690.3 2.6522 2,377.0 24,719.5 7930.7 9.472.2 5549 1,247.0 1,7082 224.4 21,137.4 3012 3.883.3 1,376.4 499.2 1914 (170.3) 5,780.0 1,2620 4,518.0 (0.3) 4,518.3 3.27 3.24 397 (437.0) 1,164.4 239.7 924.7 (3.6) 9283 S 0.79 S 0.79 S 622.8 96.5 (331.0) 4,466.2 871.6 3,594.6 (4.6) 3,599.2 2.95 $ 2.92 $ 1.172.8 1,181.8 1.221.2 1,233.2 1,382.7 1,394,6 See Notes to Consolidated Financial Statements. STARBUCKS CORPORATION CONSOLIDATED STATEMENTS OF EARNINGS (in millions, except per share data) Sep 27, 2020 Sep 29, 2019 Sep 30, 2018 Fiscal Year Ended Net revenues. Company-operated stores Licensed stores Other Total net revenues Product and distribution costs Store operating expenses Other operating expenses Depreciation and amortization expenses General and administrative expenses Restructuring and impairments Total operating expenses Income from equity investees Operating income Gain resulting from acquisition of joint venture Net gain resulting from divestiture of certain operations Interest income and other, net Interest expense Earnings before income taxes Income tax expense Net earnings including noncontrolling interests Net loss attributable to noncontrolling interests Net eamings attributable to Starbucks Earnings per share-basic Earnings per share -- diluted Weighted average shares outstanding Basic Diluted 19,164.6 $ 2,327.1 2,0263 23,518.0 7,6949 10,764.0 430.3 1,431.3 1,6796 278.7 22,278.8 322.5 1,561.7 21,544.4 S 2,875.0 2,0892 26,508.6 8.5269 10.493.6 371.0 1,377.3 1,824.1 135.8 22,728.7 298.0 4,077.9 19,690.3 2.6522 2,377.0 24,719.5 7930.7 9.472.2 5549 1,247.0 1,7082 224.4 21,137.4 3012 3.883.3 1,376.4 499.2 1914 (170.3) 5,780.0 1,2620 4,518.0 (0.3) 4,518.3 3.27 3.24 397 (437.0) 1,164.4 239.7 924.7 (3.6) 9283 S 0.79 S 0.79 S 622.8 96.5 (331.0) 4,466.2 871.6 3,594.6 (4.6) 3,599.2 2.95 $ 2.92 $ 1.172.8 1,181.8 1.221.2 1,233.2 1,382.7 1,394,6 See Notes to Consolidated Financial Statements. STARBUCKS CORPORATION CONSOLIDATED BALANCE SHEETS (in millions, cep per share data) Sep 27. 2020 Sep 29. 2019 4.350,9 s 281.2 883.4 1.551.4 7395 7.806.4 2061 478.7 6,241.4 8,134.1 1,789.9 5686 552.1 3.597.2 29 3745 S 2,686.6 70.5 8792 1,529.4 4882 5,653.9 2200 396.0 6,431.7 1,765.8 479.6 781.8 3.490.8 19,219.6 S ASSETS Current assets Cash and cash equivalents Short-term investments Accounts receivable, net Inventories Prepaid expenses and other current assets Total current assets Long-term investments Equity investments Property, plant and equipment, net Operating lease, right-of-use asset Deferred income taxes, nel Other long-term assets Other intangible assets Goodwill TOTAL ASSETS LIABILITIES AND SHAREHOLDERS' EQUITY/(DEFICIT) Current liabilities: Accounts payable Accrued liabilities Accrued payroll and benefits Income taxes payable Current portion of operating lease liability Stored value card liability and current portion of deferred revenue Short-term debe Current portion of long-term debt Total current liabilities Long term debt Operating lease liability Deferred revenue Other long-term liabilities Total liabilities Shareholders' delicit Common stock (50.001 par value) - authorized, 2,400.0 shares; issued and outstanding. 1,173.3 and 1,1846 shares, respectively Additional paid-in capital Retained deficit Accumulated other comprehensive loss Total shareholders' deficit Noncontrolling interests Total deficit TOTAL LIABILITIES AND SHAREHOLDERS' EQUITY DEFICIT) 1.1897 1,753.7 6646 1,291.7 1,269.0 9979 $ 1,160,7 696.0 982 1.248.8 1.456.5 438 1.249.9 7,346.8 14,659.6 7.661.7 6,598,5 9073 37.173.9 6,168.7 11,167.0 6,7444 1,370.5 25.450.6 1.2 373.9 (7.8156) (3646) (7.805.1) 5.7 (7.7994) 29,374.5 S 1.2 41.1 (5,7712) (5033) (6.232.2) 12 (6,231.0) 19,219.6 See Notes to Consolidated Financial Statements. STARBUCKS CORPORATION CONSOLIDATED STATEMENTS OF EARNINGS (in millions, except per share data) Sep 27, 2020 Sep 29, 2019 Sep 30, 2018 Fiscal Year Ended Net revenues. Company-operated stores Licensed stores Other Total net revenues Product and distribution costs Store operating expenses Other operating expenses Depreciation and amortization expenses General and administrative expenses Restructuring and impairments Total operating expenses Income from equity investees Operating income Gain resulting from acquisition of joint venture Net gain resulting from divestiture of certain operations Interest income and other, net Interest expense Earnings before income taxes Income tax expense Net earnings including noncontrolling interests Net loss attributable to noncontrolling interests Net eamings attributable to Starbucks Earnings per share-basic Earnings per share -- diluted Weighted average shares outstanding Basic Diluted 19,164.6 $ 2,327.1 2,0263 23,518.0 7,6949 10,764.0 430.3 1,431.3 1,6796 278.7 22,278.8 322.5 1,561.7 21,544.4 S 2,875.0 2,0892 26,508.6 8.5269 10.493.6 371.0 1,377.3 1,824.1 135.8 22,728.7 298.0 4,077.9 19,690.3 2.6522 2,377.0 24,719.5 7930.7 9.472.2 5549 1,247.0 1,7082 224.4 21,137.4 3012 3.883.3 1,376.4 499.2 1914 (170.3) 5,780.0 1,2620 4,518.0 (0.3) 4,518.3 3.27 3.24 397 (437.0) 1,164.4 239.7 924.7 (3.6) 9283 S 0.79 S 0.79 S 622.8 96.5 (331.0) 4,466.2 871.6 3,594.6 (4.6) 3,599.2 2.95 $ 2.92 $ 1.172.8 1,181.8 1.221.2 1,233.2 1,382.7 1,394,6 See Notes to Consolidated Financial Statements


