Instructions:
I. Resolve the ratios listed on table a for each year (2020 & 2021)
a. For each ratio includes the formula with math computes
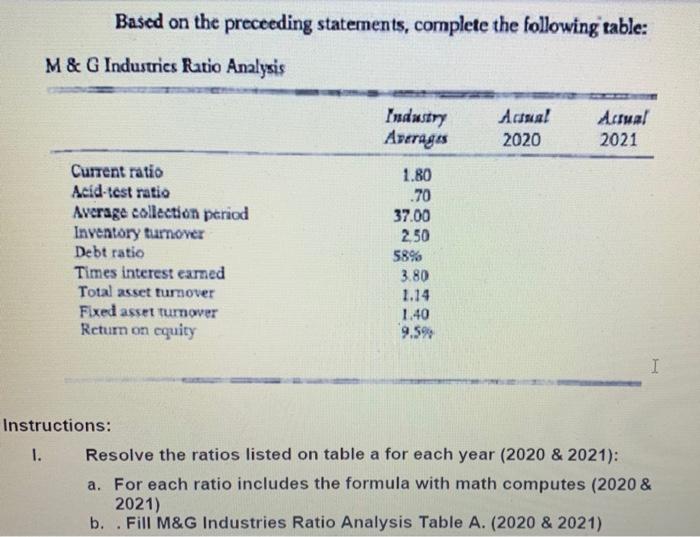
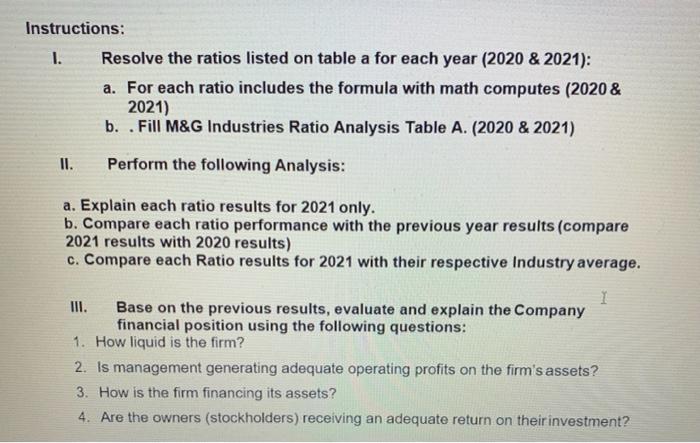
 (2020 & 2021)
b. Fill M&G Industries Ratio Analysis Table A. (2020 & 2021)
II. Perfom the following Analysis:
a. Explain each ratio results for 2021 only.
b. Compare each ratio performance with the previous year results (compare 2021 results with 2020 results)
c. Compare each Ratio results for 2021 with their respective Industry average.
III. Base on the previous results, evaluate and explain the Company financial position using the following questions:
1. How liquid is the firm?
2. Is management generating adequate operating profits on the firm's assets?
3. How is the firm financing its assets?
4. Are the owners (stockholders) receiving and adequate return on their investement?
Analysis of Financial Statements (Financial Ratios) M & G Industries Balance Sheet For December 31, 2020 and 2021 2020 2021 Cash Accounts receivable Inventories Total current assets Land Buildings and equipment Less: allowance for depreciation Total fixed assets Total assets Accounts Payable Short-term bank notes Total current liabilities Long-term debt Common stock Retained earnings Total debt and equity $ 9,000 12,500 29,000 $ 50,500 20,000 70,000 (28,000) $ 62,000 $112.500 $ 10,500 17,000 $ 27,500 28,750 31,500 24,750 $112,500 $ 500 16,000 45,500 $ 62,000 26,000 100,000 (38,000) $ 88,000 $150,000 $ 22,000 47,000 $ 69,000 22,950 31,500 26,550 $150,000 M & G Industries Income Statement For the Years Ended December 31, 2020 and 2021 2020 2021 $125,000 75,000 $ 50,000 $160.000 96,000 $ 64,000 Sales (all credit) Cost of goods sold Gross profit Operating expenses Fixed cash operating expenses Variable operating expenses Depreciation $ 21.000 12.500 4 500 S 21.000 16.000 10.000 M&G Industries Income Statement For the Years Ended December 31, 2020 and 2021 2020 2021 $125,000 75,000 $ 50,000 $160,000 96,000 $ 64,000 Sales (all credit) Cost of goods sold Gross profit Operating expenses Fixed cash operating expenses Variable operating expenses Depreciation Total operating expenses Earnings before interest and taxes Interest expense Earnings before taxes Taxes Net income $ 21,000 12,500 4,500 $ 38,000 $ 12,000 3,000 $ 9.000 4,500 $ 4.500 $ 21,000 16,000 10,000 $ 47,000 $ 17,000 6,100 $ 10,900 5,450 $5,450 Based on the preceeding statements, complete the following table: M & G Industries Ratio Analysis Industry Averages Actual 2020 Actua! 2021 Current ratio Acid-test ratio Average collection period Inventory turnover Debt ratio Times interest eamed Total asset tumover Fixed asset turnover Return on cquity 1.80 .70 37.00 2.50 58% 3.80 1.14 1.40 9.5% I Instructions: 1. Resolve the ratios listed on table a for each year (2020 & 2021): a. For each ratio includes the formula with math computes (2020 & 2021) b. Fill M&G Industries Ratio Analysis Table A. (2020 & 2021) Instructions: 1. Resolve the ratios listed on table a for each year (2020 & 2021): a. For each ratio includes the formula with math computes (2020 & 2021) b. .Fill M&G Industries Ratio Analysis Table A. (2020 & 2021) II. Perform the following Analysis: a. Explain each ratio results for 2021 only. b. Compare each ratio performance with the previous year results (compare 2021 results with 2020 results) c. Compare each Ratio results for 2021 with their respective Industry average. 1 Base on the previous results, evaluate and explain the Company financial position using the following questions: 1. How liquid is the firm? 2. Is management generating adequate operating profits on the firm's assets? 3. How is the firm financing its assets? 4. Are the owners (stockholders) receiving an adequate return on their investment