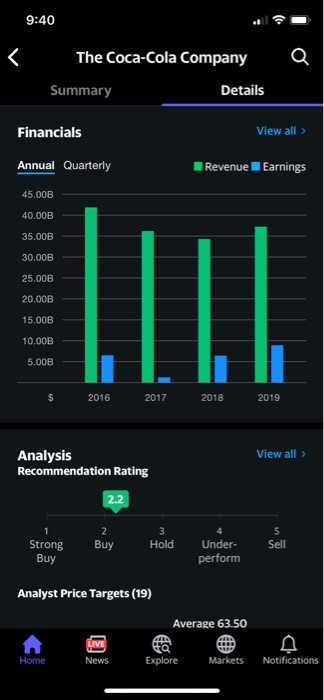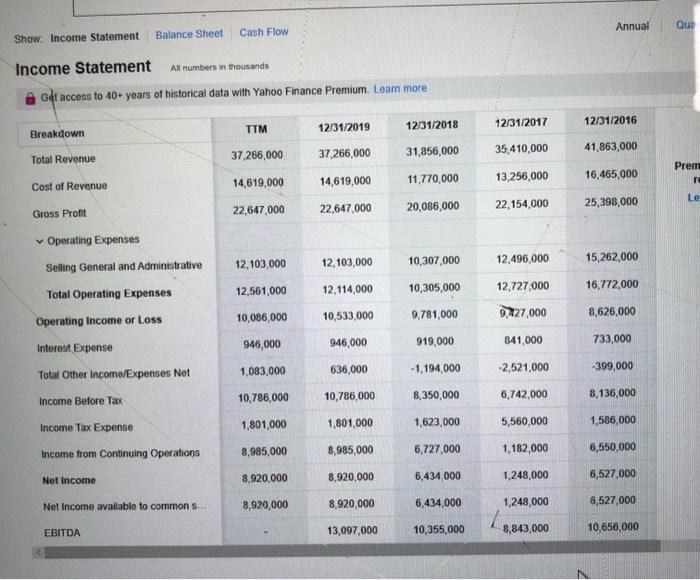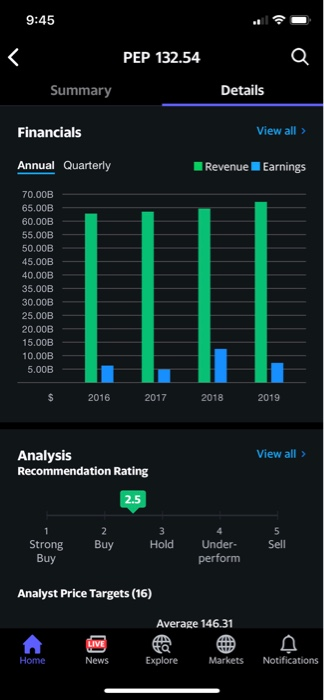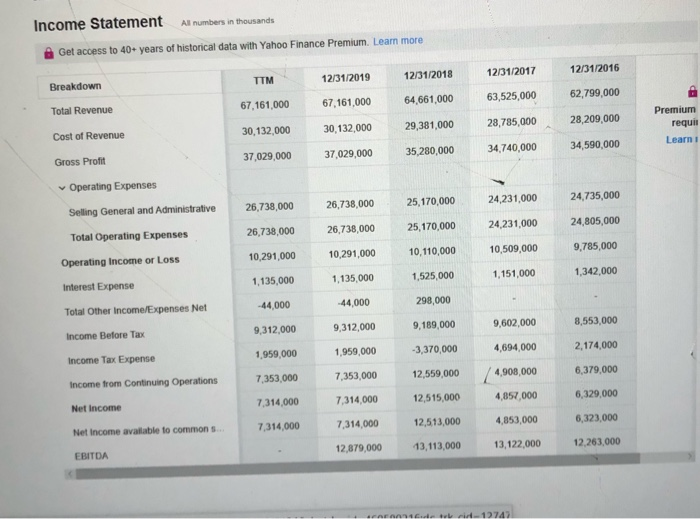
Instructions In this part of the Research Project Assignment, I am asking you to compare the capital structure for your assigned companies over the last 3-5 years. Most of the information can be pulled easily from the firm's 10K or from Yahoo Finance or from Morninstar or from Bloomberg. Get at least 3 years but don't go beyond 5 years. Before you simply leap into the fray and start calculating debt ratios, though, you should first think about the assets that have to be funded by capital. For example, we have looked at the concept of temporary current assets and permanent current assets. Temporary current assets are the fluctuations throughout the course of the year that companies sometimes fund using permanent capital (long-term debt and equity). The first step should be a simply evaluation of the types of assets that they are reporting on the balance sheet. What proportion is current assets, what proportion is net property plant and equipment, what proportion is other long term assets? Of the current assets, is it mostly inventory? Accounts receivable? Other? Cash? A quick look at a common size balance sheet should do the trick there. And are those numbers stable or moving around? The next step would be to look at the book value of liabilities. You will want to distinguish long-term debt from short-term debt and interest bearing debt from non-interest bearing debt. Are the liabilities going up, down, or sideways? In a future assignment, we will take an in-depth look at the structure of the bonds by maturity, simply by looking in the FINRA database or by looking at what is being reported in Bloomberg. For now, though, just focus on the big picture. The next step is to evaluate the book value of equity. The major components of equity are contributed capital (common stock and paid in capital), retained capital (retained earnings), and TRAIN taal 14 onlan for hans The next step is to evaluate the book value of equity. The major components of equity are contributed capital (common stock and paid in capital), retained capital (retained earnings), and Treasury Stock (if any). Look for changes over time -- some of these firms are doing massive stock buybacks, and that can really change things up for investors. We will come back to dividends and repurchases in the future, but you are just looking for the big picture here. Finally, look at the relationship between the book value of equity and the market value of equity (market capitalization). How is that evolving? Market cap is not a GAAP measure and so it isn't found in the 10K, but it is easily obtained by multiplying share prices at end-of-year times the number of outstanding years. Share counts are located in sites like Yahoo Finance, as is the end- of-year share price. It is buried somewhere in Morningstar as well, and it must be in Bllomberg, too. In doing your comparisons, you will want to crank out some ratios like the debt ratio, but remember that there is a difference between the debt ratio calculated using book values (accounting values) and the debt ratio using market values. We typically assume that the book value of liabilities is pretty close to the market value, but the book value of equity is typically much smaller than the market value. As you are comparing the firms, look for changes or trends in either or both companies. Are they moving closer to one another, or are they diverging. When you look at the make-up of the assets, is that similar or different? Look at interest expense coverage ratios like the Times Interest Earned (TIE) ratio and its many variants -- is the coverage going up, down, or sideways. And even if it is going up, is the ratio value material? For example, let's say that operating income for ABC corporation was $10,000,000 and interest expense was $1,000 (TIE=10,000.0). Next year interest expense went up to $50,000 while operating income dropped to CR 100.000 Tha TIF ratin hoe imolador dronning from example, let's say that operating income for ABC corporation was $10,000,000 and interest expense was $1,000 (TIE=10,000.0). Next year interest expense went up to $50,000 while operating income dropped to $8,000,000. The TIE ratio has imploded, dropping from 10,000x to only 160x. Even so, that still means that the firm had accounting income that was sufficient to pay the interest expense 160 times over (which is plenty). Completion You should consider the best way to incorporate graphics and/or tables into you report, but don't simply describe the table numbers or graph to me (graphs speak for themselves). Rather, try to interpret what the graph is illustrating. Good graphs cut out a lot of typing. Review the analyst reports that I have posted to get a flavor for how they report stuff. This is due by Wednesday 3/11 at 8:00 am prior to class. We will be comparing results in class at that point, so in addition to turning something in via Blackboard, you may want to keep a copy that you can refer to. If pull your submission up and it is blank, you will lose all the points for this part of the assignment, and you will have to do it anyway to be able to complete the assignment, so save us both some trouble and just do it. You will have the opportunity to improve on your submission -- at this point, we want to see what we are seeing. Write up you analysis in Word or its equivalent and attach it to the submission. Name it Last Name_FirstName_Assign_02.docx. Grammar counts. Spelling counts. Readability counts. Formatting counts. Make it look professional. Coca-Cola vs Pepsi 9:40 The Coca-Cola Company Summary Details Financials View all > Annual Quarterly Revenue Earnings 45.00B 40.00B 35.00B 30.00B 25.00B 20.00B 15.00B 10.00B - 5.00B - $ 2016 2017 2018 2019 View all > Analysis Recommendation Rating 2.2 2 Buy 3 Hold 5 Sell Strong Buy Under- perform Analyst Price Targets (19) Average 63.50 LIVE News Home Explore Markets Notifications Annual Show: Income Statement Que Cash Flow Balance Sheet Income Statement All numbers in thousands Get access to 40+ years of historical data with Yahoo Finance Premium. Learn more 12/31/2016 12/31/2017 12/31/2018 12/31/2019 Breakdown TTM 31,856,000 35,410,000 37,266,000 Total Revenue 41,863,000 37,266,000 Prem 11,770,000 16,465,000 14,619,000 13,256,000 Cost of Revenue 14,619,000 22,647,000 Le 20,086,000 22,647,000 25,398,000 22,154,000 Gross Profit Operating Expenses 12,103,000 12,103,000 10,307,000 12,496,000 Selling General and Administrative 15,262,000 12,561,000 Total Operating Expenses 12,114,000 12,727,000 10,305,000 16,772,000 10,086,000 10,533,000 9,781,000 9,227,000 Operating Income or Loss 8,626,000 946,000 Interest Expense 946,000 841,000 919,000 733,000 1,083,000 Total Other Income/Expenses Net 636,000 -2,521,000 -1,194,000 -399,000 10,786,000 Income Before Tax 10,786,000 6,742,000 8,350,000 8,136,000 1,801,000 1,623,000 1,801,000 5,560,000 Income Tax Expense 1,586,000 Income from Continuing Operations 8,985,000 8,985,000 6,727,000 1,182,000 6,550,000 Net Income 8,920,000 8,920,000 6,434,000 6,527,000 1,248,000 Net Income available to common s... 8,920,000 8.920,000 6,434,000 1,248,000 6,527,000 EBITDA 13,097,000 10,355,000 8,843,000 10,656,000 9:45 PEP 132.54 Summary Details Financials View all > Annual Quarterly Revenue Earnings 70.00B 65.00B 60.00B 55.00B 50.00B 45.00B 40.00B 35.00B 30.00B 25.00B- 20.00B 15.00B 10.00B 5.00B - $ 2016 2017 2018 2019 View all > Analysis Recommendation Rating 2.5 5 Buy 3 Hold Sell Strong Buy Under- perform Analyst Price Targets (16) Average 146.31 LIVE News Home Explore Markets Notifications Income Statement All numbers in thousands Get access to 40+ years of historical data with Yahoo Finance Premium. Learn more Breakdown TTM 12/31/2019 12/31/2018 12/31/2017 12/31/2016 Total Revenue 67,161,000 67,161,000 64.661,000 63,525,000 62,799,000 Cost of Revenue 30,132,000 30,132,000 28,785,000 28,209,000 29,381,000 35,280,000 Premium requi Learn Gross Profit 37,029,000 37,029,000 34,740,000 34,590,000 Operating Expenses Selling General and Administrative 26,738,000 26,738,000 24,231,000 24,735,000 25,170,000 25,170,000 Total Operating Expenses 26,738,000 26,738,000 24,231,000 24,805,000 Operating Income or Loss 10,291,000 10,291,000 10,110,000 10,509,000 9,785,000 1,342,000 Interest Expense 1,135,000 1,135.000 1,525,000 1,151,000 Total Other Income/Expenses Net -44,000 44,000 298,000 Income Before Tax 9,312,000 9,312,000 9,189,000 9,602,000 8,553,000 2,174,000 Income Tax Expense 1,959,000 1,959,000 -3,370,000 4,694,000 Income from Continuing Operations 7,353,000 7,353,000 12,559,000 6,379,000 4,908,000 4,857.000 Net Income 7,314,000 7,314,000 12,515,000 6,329,000 Net Income available to common s... 7,314,000 7,314,000 12,513,000 4,853,000 6,323,000 EBITDA 12,879,000 13,113,000 13,122,000 12,263,000 Instructions In this part of the Research Project Assignment, I am asking you to compare the capital structure for your assigned companies over the last 3-5 years. Most of the information can be pulled easily from the firm's 10K or from Yahoo Finance or from Morninstar or from Bloomberg. Get at least 3 years but don't go beyond 5 years. Before you simply leap into the fray and start calculating debt ratios, though, you should first think about the assets that have to be funded by capital. For example, we have looked at the concept of temporary current assets and permanent current assets. Temporary current assets are the fluctuations throughout the course of the year that companies sometimes fund using permanent capital (long-term debt and equity). The first step should be a simply evaluation of the types of assets that they are reporting on the balance sheet. What proportion is current assets, what proportion is net property plant and equipment, what proportion is other long term assets? Of the current assets, is it mostly inventory? Accounts receivable? Other? Cash? A quick look at a common size balance sheet should do the trick there. And are those numbers stable or moving around? The next step would be to look at the book value of liabilities. You will want to distinguish long-term debt from short-term debt and interest bearing debt from non-interest bearing debt. Are the liabilities going up, down, or sideways? In a future assignment, we will take an in-depth look at the structure of the bonds by maturity, simply by looking in the FINRA database or by looking at what is being reported in Bloomberg. For now, though, just focus on the big picture. The next step is to evaluate the book value of equity. The major components of equity are contributed capital (common stock and paid in capital), retained capital (retained earnings), and TRAIN taal 14 onlan for hans The next step is to evaluate the book value of equity. The major components of equity are contributed capital (common stock and paid in capital), retained capital (retained earnings), and Treasury Stock (if any). Look for changes over time -- some of these firms are doing massive stock buybacks, and that can really change things up for investors. We will come back to dividends and repurchases in the future, but you are just looking for the big picture here. Finally, look at the relationship between the book value of equity and the market value of equity (market capitalization). How is that evolving? Market cap is not a GAAP measure and so it isn't found in the 10K, but it is easily obtained by multiplying share prices at end-of-year times the number of outstanding years. Share counts are located in sites like Yahoo Finance, as is the end- of-year share price. It is buried somewhere in Morningstar as well, and it must be in Bllomberg, too. In doing your comparisons, you will want to crank out some ratios like the debt ratio, but remember that there is a difference between the debt ratio calculated using book values (accounting values) and the debt ratio using market values. We typically assume that the book value of liabilities is pretty close to the market value, but the book value of equity is typically much smaller than the market value. As you are comparing the firms, look for changes or trends in either or both companies. Are they moving closer to one another, or are they diverging. When you look at the make-up of the assets, is that similar or different? Look at interest expense coverage ratios like the Times Interest Earned (TIE) ratio and its many variants -- is the coverage going up, down, or sideways. And even if it is going up, is the ratio value material? For example, let's say that operating income for ABC corporation was $10,000,000 and interest expense was $1,000 (TIE=10,000.0). Next year interest expense went up to $50,000 while operating income dropped to CR 100.000 Tha TIF ratin hoe imolador dronning from example, let's say that operating income for ABC corporation was $10,000,000 and interest expense was $1,000 (TIE=10,000.0). Next year interest expense went up to $50,000 while operating income dropped to $8,000,000. The TIE ratio has imploded, dropping from 10,000x to only 160x. Even so, that still means that the firm had accounting income that was sufficient to pay the interest expense 160 times over (which is plenty). Completion You should consider the best way to incorporate graphics and/or tables into you report, but don't simply describe the table numbers or graph to me (graphs speak for themselves). Rather, try to interpret what the graph is illustrating. Good graphs cut out a lot of typing. Review the analyst reports that I have posted to get a flavor for how they report stuff. This is due by Wednesday 3/11 at 8:00 am prior to class. We will be comparing results in class at that point, so in addition to turning something in via Blackboard, you may want to keep a copy that you can refer to. If pull your submission up and it is blank, you will lose all the points for this part of the assignment, and you will have to do it anyway to be able to complete the assignment, so save us both some trouble and just do it. You will have the opportunity to improve on your submission -- at this point, we want to see what we are seeing. Write up you analysis in Word or its equivalent and attach it to the submission. Name it Last Name_FirstName_Assign_02.docx. Grammar counts. Spelling counts. Readability counts. Formatting counts. Make it look professional. Coca-Cola vs Pepsi 9:40 The Coca-Cola Company Summary Details Financials View all > Annual Quarterly Revenue Earnings 45.00B 40.00B 35.00B 30.00B 25.00B 20.00B 15.00B 10.00B - 5.00B - $ 2016 2017 2018 2019 View all > Analysis Recommendation Rating 2.2 2 Buy 3 Hold 5 Sell Strong Buy Under- perform Analyst Price Targets (19) Average 63.50 LIVE News Home Explore Markets Notifications Annual Show: Income Statement Que Cash Flow Balance Sheet Income Statement All numbers in thousands Get access to 40+ years of historical data with Yahoo Finance Premium. Learn more 12/31/2016 12/31/2017 12/31/2018 12/31/2019 Breakdown TTM 31,856,000 35,410,000 37,266,000 Total Revenue 41,863,000 37,266,000 Prem 11,770,000 16,465,000 14,619,000 13,256,000 Cost of Revenue 14,619,000 22,647,000 Le 20,086,000 22,647,000 25,398,000 22,154,000 Gross Profit Operating Expenses 12,103,000 12,103,000 10,307,000 12,496,000 Selling General and Administrative 15,262,000 12,561,000 Total Operating Expenses 12,114,000 12,727,000 10,305,000 16,772,000 10,086,000 10,533,000 9,781,000 9,227,000 Operating Income or Loss 8,626,000 946,000 Interest Expense 946,000 841,000 919,000 733,000 1,083,000 Total Other Income/Expenses Net 636,000 -2,521,000 -1,194,000 -399,000 10,786,000 Income Before Tax 10,786,000 6,742,000 8,350,000 8,136,000 1,801,000 1,623,000 1,801,000 5,560,000 Income Tax Expense 1,586,000 Income from Continuing Operations 8,985,000 8,985,000 6,727,000 1,182,000 6,550,000 Net Income 8,920,000 8,920,000 6,434,000 6,527,000 1,248,000 Net Income available to common s... 8,920,000 8.920,000 6,434,000 1,248,000 6,527,000 EBITDA 13,097,000 10,355,000 8,843,000 10,656,000 9:45 PEP 132.54 Summary Details Financials View all > Annual Quarterly Revenue Earnings 70.00B 65.00B 60.00B 55.00B 50.00B 45.00B 40.00B 35.00B 30.00B 25.00B- 20.00B 15.00B 10.00B 5.00B - $ 2016 2017 2018 2019 View all > Analysis Recommendation Rating 2.5 5 Buy 3 Hold Sell Strong Buy Under- perform Analyst Price Targets (16) Average 146.31 LIVE News Home Explore Markets Notifications Income Statement All numbers in thousands Get access to 40+ years of historical data with Yahoo Finance Premium. Learn more Breakdown TTM 12/31/2019 12/31/2018 12/31/2017 12/31/2016 Total Revenue 67,161,000 67,161,000 64.661,000 63,525,000 62,799,000 Cost of Revenue 30,132,000 30,132,000 28,785,000 28,209,000 29,381,000 35,280,000 Premium requi Learn Gross Profit 37,029,000 37,029,000 34,740,000 34,590,000 Operating Expenses Selling General and Administrative 26,738,000 26,738,000 24,231,000 24,735,000 25,170,000 25,170,000 Total Operating Expenses 26,738,000 26,738,000 24,231,000 24,805,000 Operating Income or Loss 10,291,000 10,291,000 10,110,000 10,509,000 9,785,000 1,342,000 Interest Expense 1,135,000 1,135.000 1,525,000 1,151,000 Total Other Income/Expenses Net -44,000 44,000 298,000 Income Before Tax 9,312,000 9,312,000 9,189,000 9,602,000 8,553,000 2,174,000 Income Tax Expense 1,959,000 1,959,000 -3,370,000 4,694,000 Income from Continuing Operations 7,353,000 7,353,000 12,559,000 6,379,000 4,908,000 4,857.000 Net Income 7,314,000 7,314,000 12,515,000 6,329,000 Net Income available to common s... 7,314,000 7,314,000 12,513,000 4,853,000 6,323,000 EBITDA 12,879,000 13,113,000 13,122,000 12,263,000
