

Question
Instructions: ONLY DO PROFITABILITY RATIOS - Nothing else. No need to worry about the graphs either. Just need the ratios worked out. Equations to use:
Instructions: ONLY DO PROFITABILITY RATIOS - Nothing else. No need to worry about the graphs either. Just need the ratios worked out.
Equations to use: CHOOSE 3 OUT OF 5 TO SOLVE
FIRST COMPANY: T-Mobile
SECOND COMPANY: AT&T
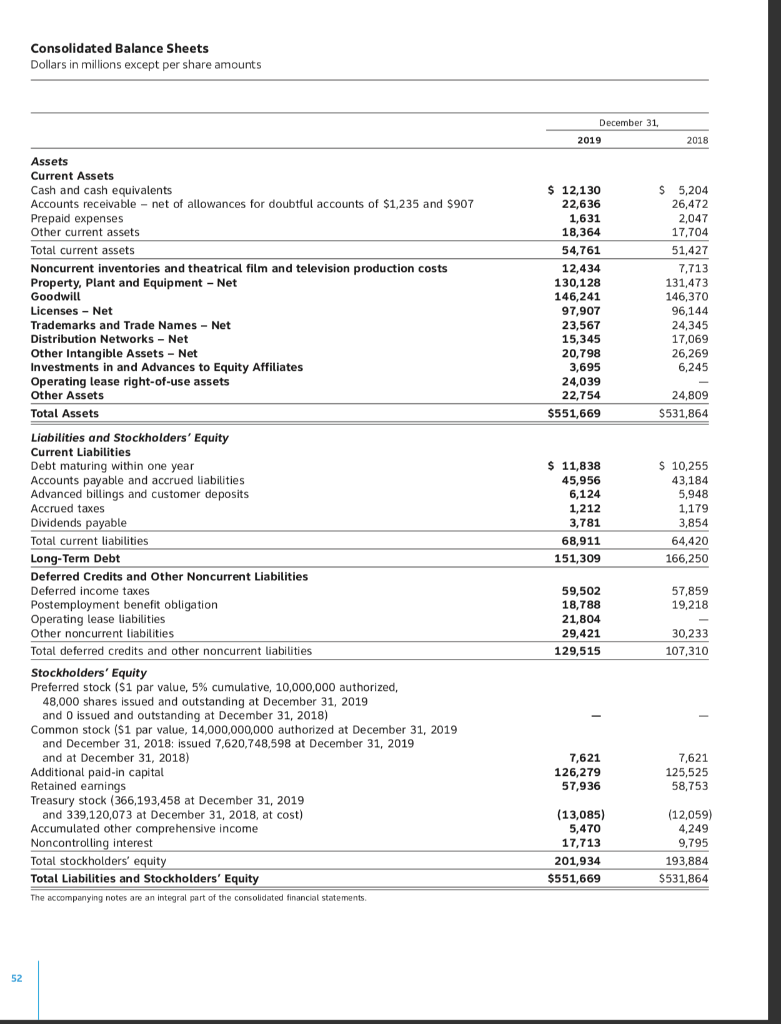
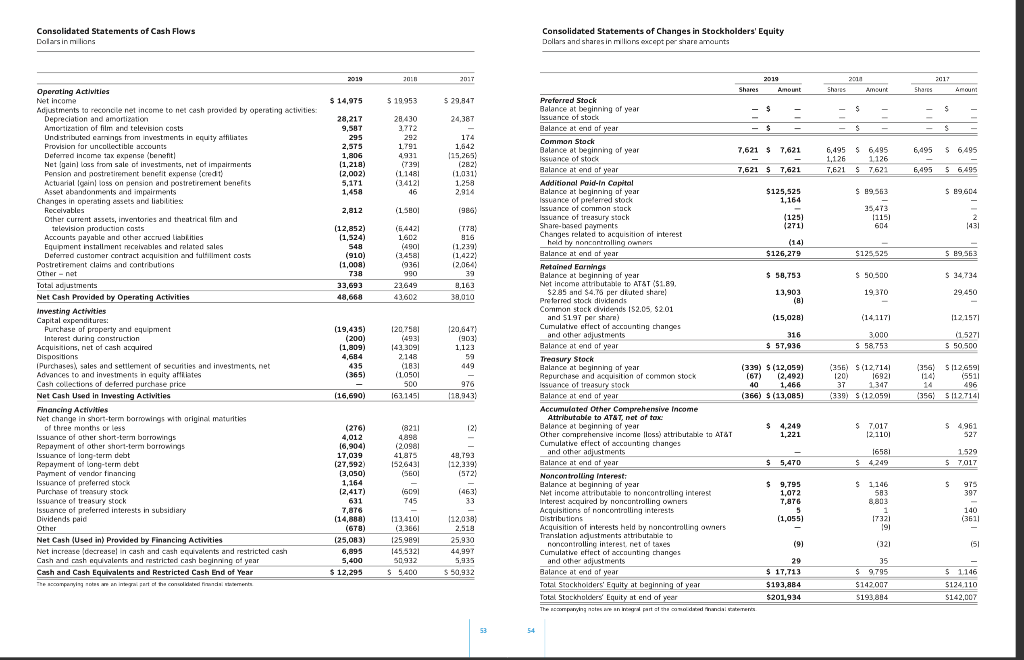
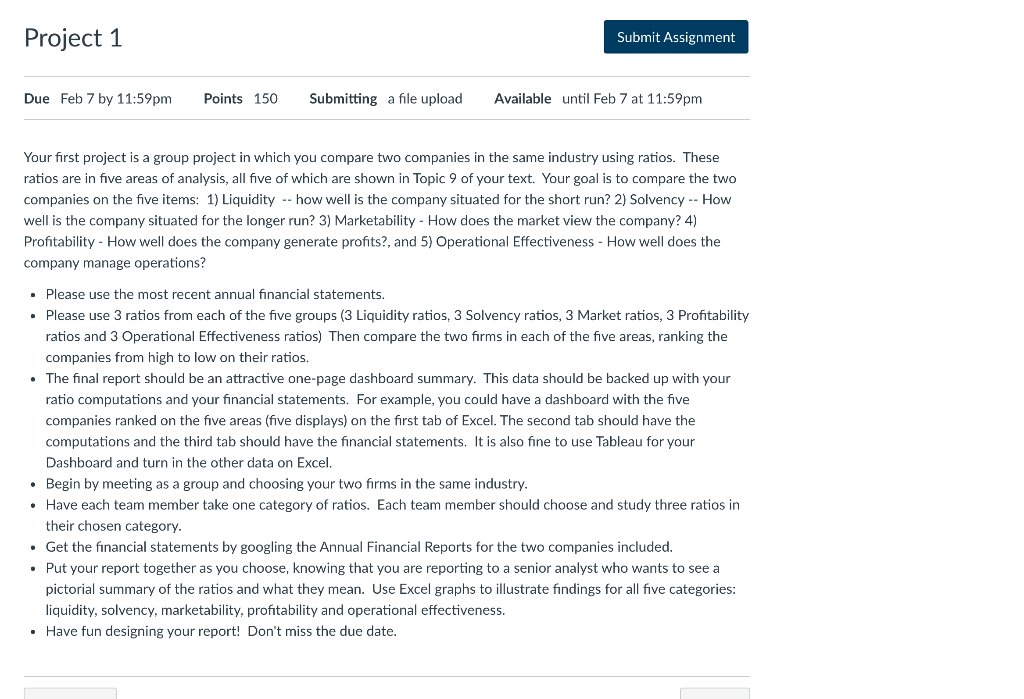
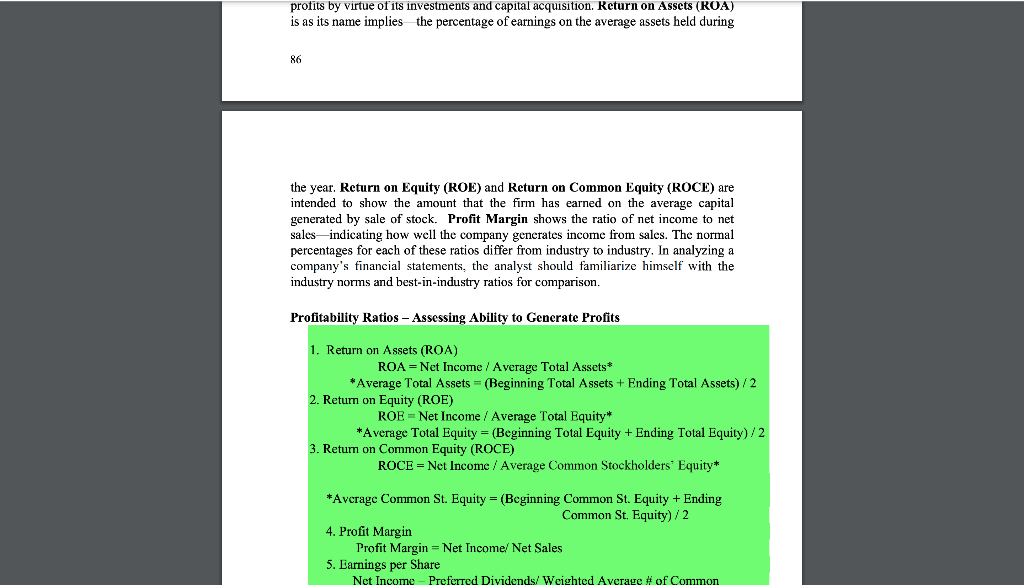
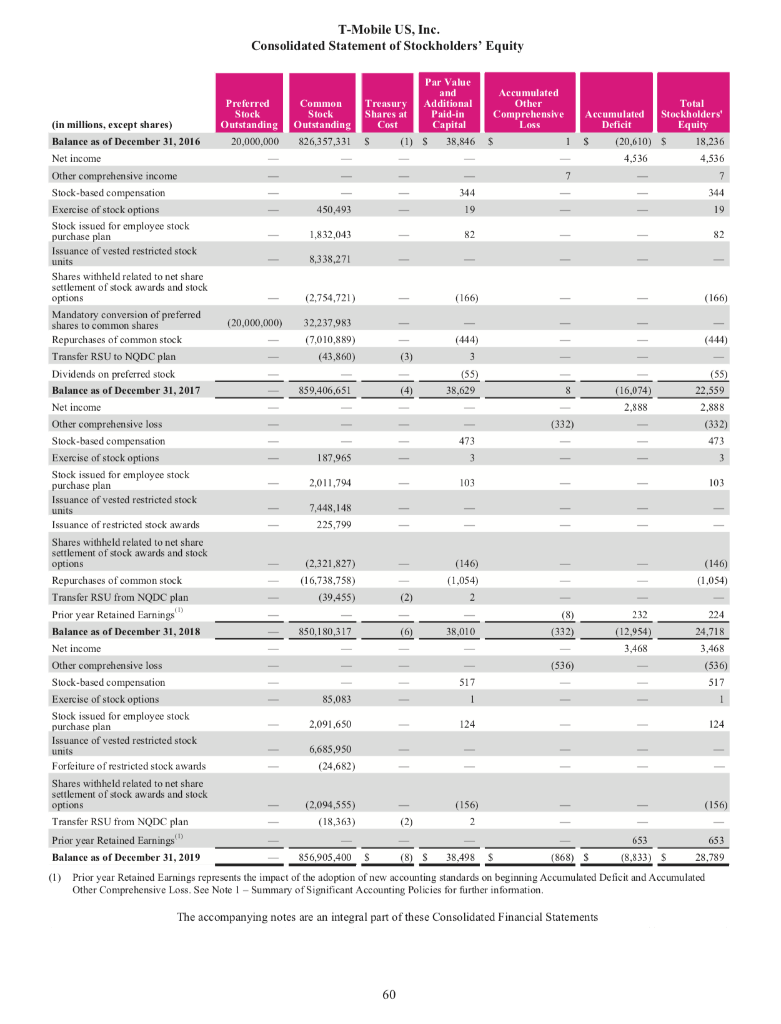
Project 1 Submit Assignment Due Feb 7 by 11:59pm Points 150 Submitting a file upload Available until Feb 7 at 11:59pm Your first project is a group project in which you compare two companies in the same industry using ratios. These ratios are in five areas of analysis, all five of which are shown in Topic 9 of your text. Your goal is to compare the two companies on the five items: 1) Liquidity -- how well is the company situated for the short run? 2) Solvency -- How well is the company situated for the longer run? 3) Marketability - How does the market view the company? 4) Profitability - How well does the company generate profits?, and 5) Operational Effectiveness - How well does the company manage operations? Please use the most recent annual financial statements. . Please use 3 ratios from each of the five groups (3 Liquidity ratios, 3 Solvency ratios, 3 Market ratios, 3 Profitability ratios and 3 Operational Effectiveness ratios) Then compare the two firms in each of the five areas, ranking the companies from high to low on their ratios. The final report should be an attractive one-page dashboard summary. This data should be backed up with your ratio computations and your financial statements. For example, you could have a dashboard with the five companies ranked on the five areas (five displays) on the first tab of Excel. The second tab should have the computations and the third tab should have the financial statements. It is also fine to use Tableau for your Dashboard and turn in e other data on Excel. Begin by meeting as a group and choosing your two firms in the same industry. Have each team member take one category of ratios. Each team member should choose and study three ratios in their chosen category. Get the financial statements by googling the Annual Financial Reports for the two companies included. Put your report together as you choose, knowing that you are reporting to a senior analyst who wants to see a pictorial summary of the ratios and what they mean. Use Excel graphs to illustrate findings for all five categories: liquidity, solvency, marketability, profitability and operational effectiveness. Have fun designing your report! Don't miss the due date. profits by virtue of its investments and capital acquisition. Return on Assets (ROA) is as its name implies the percentage of earnings on the average assets held during 86 the year. Return on Equity (ROE) and Return on Common Equity (ROCE) are intended to show the amount that the firm has earned on the average capital generated by sale of stock. Profit Margin shows the ratio of net income to net sales indicating how well the company generates income from sales. The normal percentages for each of these ratios differ from industry to industry. In analyzing a company's financial statements, the analyst should familiarize himself with the industry norms and best-in-industry ratios for comparison. Profitability Ratios - Assessing Ability to Generate Profits 1. Return on Assets (ROA) ROA = Net Income / Average Total Assets* *Average Total Assets = (Beginning Total Assets + Ending Total Assets)/2 2. Return on Equity (ROE) ROE = Net Income / Average Total Equity* *Average Total Equity = (Beginning Total Equity + Ending Total Equity)/2 3. Return on Common Equity (ROCE) ROCE = Net Income / Average Common Stockholders' Equity* *Average Common St. Equity = (Beginning Common St. Equity + Ending Common St. Equity)/2 4. Profit Margin Profit Margin = Net Income/ Net Sales 5. Earnings per Share Net Income - Preferred Dividends/ Weighted Average # of Common Ver cm T-Mobile US, Inc. T-Mobile US, Inc. Consolidated Statements of Comprehensive Income Consolidated Statements of Cash Flows Year Ended December 31, Yaraded December 1, in millions, except share and per share amounts) 2419 2017 mitone 2019 MIS 2017 Herennes Operating artistin Branded posiider S 3.469 S 19:44 2012 2.898 5 4536 Branded prepaid revenues 09 41 Adjustments to reconcile net income to net cash provided by operating activities Depreciation and maintain 616 46 504 Wholes 1,279 Stockholm 195 . Rowning with services 404 119 Deleted in one ux pubenen 1,091 90 Baddi experte 307 358 Total TV $1994 1192 INI Lose front of his 157 Fau 9.140 100 Deferred Loesun rodemusic of de alle 19 BE 122 Odier revers 1.164 1.309 1.00 Gains on disposal of spectrum en Tobivenes 44.00 43310 4061 Changinapatikanities Operating expenses Accelerosivable 180111 Euture Aurreceiables (1.013) (1.9981 118121 Cost of services, exclusive of depresion and mortization stown separately below 6,023 (309 6.100 (617) Cost of equipment sales.exclusive depreciation and ametization shoor separately below Octus les causes ILANO 1.996 12.047 16 Other current and Internet 1181 Sisi Selling and administrative 14,139 13.161 12.10 Assouls avall Belishildis 17 1070 Depreciation and mortation 615 1964 Slavet and long-term operating loue liabilities (2.131 Coins ont la peine Se 44 Oher current and long terbaits 12131 be Other 52 Totale 1919 TR001 15216 Nel cavall parts 6,524 3.899 3.811 Operating income 5.12) S14 Investing nettsides XAN consolroperty and including dat SATI, SIA! and it 11 2171 Other inname experie) Purchase or specirun licenses and the inanghals, including cupsis 1957) 11271 15.828 Intersteepers (121) 18151 11,111) mitted inr miles fier sis 13 Proceeds to beneficial interests in Sections 3.576 4319 limisperioaffic INI) Nestandard in der under exchange Inies incum 19 Acquisiton of companies net of cash acquired ISINI Other pros al 1) 1941 Clerc 21 Tualeterapi 15191 675 (1.119 11.392 Net cashed in investing activities 11,727) F Fairvies Inerte here 4.NI! 3,161 Incum as lexpertech berci Proceed from swipuneraliilis 1,375 2,340 1365 Reporters of revolving credit they (6,3651 12.9101 Net income 1469 Reporters of financirglar shligaties Dividends on preferred neck Repayment of shariam dich feudanes olivenleyperly anal and Rep of long-term debe 3001 1020 Net ircnet weder $ 1:46 25 44RI W! Repurchases of common stock ( 19271 Tax wkolines on suure based awards 1136 11401 1160 $ 1.46 Dividends are $ 1551 Other comprende che imme, unul fax Gul penis fur de parlerliyilmer ereli 1158 152 mai in villages, nes abus discursul Net cushed in tinting activits CUTI 4330 1307 Change in each cuivalent hadial brondwhals, notex lectus IT) 5015 anal 0 12.5 in (9351 (312 Cupheash quivalents Cherie A 13121 Begingo parlod 1.NO INO End of S Total comercrive income 2.932 1,528 S 1219 2.556 Supplemental disclosure of cash How information Earn perre Interest paymers, tot amounts cap S 5 1.1285 1,525 $ 2028 Basic S 405S 3.40 5 9.39 pumily wrmit '' 2, In this 5! Dwied 11 S 4025 . 5.31 Non-cash investing and financing activities Waghted average shar sutstanding Nim-ced hencheidinkra blandit scharge for sure nacivables $ $ 4,50 S 492 $ 4053 811S (Decrease increase in culpable Sor purchases of retty and equipment 1935) 65 313 313 863431,911 888 2014 Druid 1,011 Lexed deres transferred from two to property and equipment 89136749 1.11 Retumed lessed devices carstered trom property and equipment to inventory 13261 17421 Short-ter desumed for finding of property and cauiem The accompanying notes are an integral part of these Consolidated Financial Statements Operatinelasenahof-use sets obtined in exchange for lease oblations 3.0 Firenciry large this in charges 1.041 867 (L) On lumay , 2019, we adopted Accounting Sandards Update (ASU) 2015-02, "Leases (Topk 82" which requires cercan supplement cash flow dsclosures Where these disclosures or a comparable figure were not required under the former leise udud, we have to trospecdvely presented Tiskarkust. See Note. Suntury of Significant Account Policies for additional details. 0 Other The accompanying nose an integral of the Calidate Financial Statements. 58 59 T-Mobile US, Inc. Consolidated Statement of Stockholders' Equity Par Value and Accumulated Preferred Common Treasury Additional Other Total Stock Stock Shares at Paid-in Comprehensive Accumulated Stockholders' (in millions, except shares) Outstanding Outstanding Cost Capital Loss Deficit Equity Balance as of December 31, 2016 20,000,000 826,357,331 S (1) S 38,846 $ 1 S (20,610) $ 18,236 Net income 4,536 4,536 Other comprehensive income 7 7 Stock-based compensation 344 344 Exercise of stock options 450,493 19 19 Stock issued for employee stock purchase plan 1,832,043 82 82 Issuance of vested restricted stock units 8,338,27 Shares withheld related to net share settlement of stock awards and stock options (2,754,721) (166) (166) Mandatory conversion of preferred shares to common shares (20,000,000) 32,237,983 Repurchases of common stock (7,010,889) (444) Transfer RSU to NODC plan (43.860) (3) 3 Dividends on preferred stock (55) (55) Balance as of December 31, 2017 859.406,651 (4) 38,629 8 (16,074) 22.559 Net income 2.888 2.888 Other comprehensive less (332) (332) Stock-based compensation 473 473 Exercise of stock options 187,965 3 3 3 Stock issued for employee stock purchase plan 2,011,794 103 103 Issuance of vested restricted stock units 7,448,148 Issuance of restricted stock awards 225,799 - Shares withheld related to net share settlement of stock awards and stock options (2.321,827) (146) (146) Repurchases of common stock (16,738,758) (1,054) (1.054) Transfer RSU from NQDC plan (39,455) (2) 2 Prior year Retained Earnings (8) 232 224 Balance as of December 31, 2018 850.180,317 (6) 38.010 (332) (12.954) 24,718 Net income 3,468 3,468 Other comprehensive loss (536) (536) Stock-based compensation 517 517 Exercise of stock options 85,083 1 1 Stock issued for employee stock purchase plan 2,091,650 124 124 Issuance of vested restricted stock units 6,685,950 Forfeiture of restricted stock awards (24,682) Shares withheld related to net share settlement of stock awards and stock options (2,094,555) (156) (156) Transfer RSU from NQDC plan (18,363) (2) 2 Prior year Retained Earnings 653 653 Balance as of December 31, 2019 856,905,400 S (8) S 38.498 $ (868) S (8,833) S 28,789 (1) Prior year Retained Eurnings represents the impact of the adoption of new accounting standards on beginning Accumulated Deficit and Accumulated Other Comprehensive Loss See Note 1 - Summary of Significant Accounting Policies for further information, The accompanying notes are an integral part of these Consolidated Financial Statements 60 Consolidated Balance Sheets Dollars in millions except per share amounts December 31, 2019 2018 Assets Current Assets Cash and cash equivalents Accounts receivable - net of allowances for doubtful accounts of $1,235 and $907 Prepaid expenses Other current assets Total current assets Noncurrent inventories and theatrical film and television production costs Property, Plant and Equipment - Net Goodwill Licenses - Net Trademarks and Trade Names - Net Distribution Networks - Net Other Intangible Assets - Net Investments in and Advances to Equity Affiliates Operating lease right-of-use assets Other Assets Total Assets $ 12,130 22,636 1,631 18,364 54,761 12,434 130,128 146,241 97,907 23,567 15,345 20,798 3,695 24,039 22,754 $551,669 $ 5,204 26,472 2,047 17,704 51,427 7,713 131,473 146,370 96,144 24,345 17,069 26,269 6,245 24,809 $531,864 $ 11,838 45,956 6,124 1,212 3,781 68,911 151,309 $ 10,255 43,184 5,948 1,179 3,854 64,420 166,250 57,859 19,218 59,502 18,788 21,804 29,421 129,515 30,233 107,310 Liabilities and Stockholders' Equity Current Liabilities Debt maturing within one year Accounts payable and accrued liabilities Advanced billings and customer deposits Accrued taxes Dividends payable Total current liabilities Long-Term Debt Deferred Credits and Other Noncurrent Liabilities Deferred income taxes Postemployment benefit obligation Operating lease liabilities Other noncurrent liabilities Total deferred credits and other noncurrent liabilities Stockholders' Equity Preferred stock ($1 par value, 5% cumulative, 10,000,000 authorized, 48,000 shares issued and outstanding at December 31, 2019 and O issued and outstanding at December 31, 2018) Common stock ($1 par value, 14,000,000,000 authorized at December 31, 2019 and December 31, 2018: issued 7,620,748,598 at December 31, 2019 and at December 31, 2018) Additional paid-in capital Retained earnings Treasury stock (366,193,458 at December 31, 2019 and 339,120,073 at December 31, 2018, at cost) Accumulated other comprehensive income Noncontrolling interest Total stockholders' equity Total Liabilities and Stockholders' Equity The accompanying notes are an integral part of the consolidated financial statements 7,621 126,279 57,936 7,621 125,525 58,753 (13,085) 5,470 17,713 201,934 $551,669 (12,059) 4,249 9,795 193,884 $531,864 52 s of Cash Flows Changes in Stockholders' Equity Shores Amount shersAmount Shanes **** Aroun $ 14,975 7,621 $ 7,623 7,621 $ 7,621 $125,825 6,495 $ 6.495 7.621 $ 7621 1956 - 1115 S - 6,495 S 6495 6,495 $ 6495 $ 89.604 129 2 Acquistion of interest $126.979 125 525 $50500 $ 89,563 $ 34,734 29,450 $ 58,753 13,903 (15,026) 43602 38.010 19.370 (14 1171 112.157 of cash could 16 E87 90.500 (2,492 1201692 1307 ca651 2365112716 (16,690) 163145 HERBA mprehensive Income iginal maturities $4249 2010 s attributable to ATAT 1930 $ 5,470 $ 9,795 7,876 (1,055 (9) 151 Cumulative effect of Balance at end of year Total, Stockholders' Equity at beginning of Total Stockholders Equity at end of year $ 11,719 $193,884 $142007 $201,934 Project 1 Submit Assignment Due Feb 7 by 11:59pm Points 150 Submitting a file upload Available until Feb 7 at 11:59pm Your first project is a group project in which you compare two companies in the same industry using ratios. These ratios are in five areas of analysis, all five of which are shown in Topic 9 of your text. Your goal is to compare the two companies on the five items: 1) Liquidity -- how well is the company situated for the short run? 2) Solvency -- How well is the company situated for the longer run? 3) Marketability - How does the market view the company? 4) Profitability - How well does the company generate profits?, and 5) Operational Effectiveness - How well does the company manage operations? Please use the most recent annual financial statements. . Please use 3 ratios from each of the five groups (3 Liquidity ratios, 3 Solvency ratios, 3 Market ratios, 3 Profitability ratios and 3 Operational Effectiveness ratios) Then compare the two firms in each of the five areas, ranking the companies from high to low on their ratios. The final report should be an attractive one-page dashboard summary. This data should be backed up with your ratio computations and your financial statements. For example, you could have a dashboard with the five companies ranked on the five areas (five displays) on the first tab of Excel. The second tab should have the computations and the third tab should have the financial statements. It is also fine to use Tableau for your Dashboard and turn in e other data on Excel. Begin by meeting as a group and choosing your two firms in the same industry. Have each team member take one category of ratios. Each team member should choose and study three ratios in their chosen category. Get the financial statements by googling the Annual Financial Reports for the two companies included. Put your report together as you choose, knowing that you are reporting to a senior analyst who wants to see a pictorial summary of the ratios and what they mean. Use Excel graphs to illustrate findings for all five categories: liquidity, solvency, marketability, profitability and operational effectiveness. Have fun designing your report! Don't miss the due date. profits by virtue of its investments and capital acquisition. Return on Assets (ROA) is as its name implies the percentage of earnings on the average assets held during 86 the year. Return on Equity (ROE) and Return on Common Equity (ROCE) are intended to show the amount that the firm has earned on the average capital generated by sale of stock. Profit Margin shows the ratio of net income to net sales indicating how well the company generates income from sales. The normal percentages for each of these ratios differ from industry to industry. In analyzing a company's financial statements, the analyst should familiarize himself with the industry norms and best-in-industry ratios for comparison. Profitability Ratios - Assessing Ability to Generate Profits 1. Return on Assets (ROA) ROA = Net Income / Average Total Assets* *Average Total Assets = (Beginning Total Assets + Ending Total Assets)/2 2. Return on Equity (ROE) ROE = Net Income / Average Total Equity* *Average Total Equity = (Beginning Total Equity + Ending Total Equity)/2 3. Return on Common Equity (ROCE) ROCE = Net Income / Average Common Stockholders' Equity* *Average Common St. Equity = (Beginning Common St. Equity + Ending Common St. Equity)/2 4. Profit Margin Profit Margin = Net Income/ Net Sales 5. Earnings per Share Net Income - Preferred Dividends/ Weighted Average # of Common Ver cm T-Mobile US, Inc. T-Mobile US, Inc. Consolidated Statements of Comprehensive Income Consolidated Statements of Cash Flows Year Ended December 31, Yaraded December 1, in millions, except share and per share amounts) 2419 2017 mitone 2019 MIS 2017 Herennes Operating artistin Branded posiider S 3.469 S 19:44 2012 2.898 5 4536 Branded prepaid revenues 09 41 Adjustments to reconcile net income to net cash provided by operating activities Depreciation and maintain 616 46 504 Wholes 1,279 Stockholm 195 . Rowning with services 404 119 Deleted in one ux pubenen 1,091 90 Baddi experte 307 358 Total TV $1994 1192 INI Lose front of his 157 Fau 9.140 100 Deferred Loesun rodemusic of de alle 19 BE 122 Odier revers 1.164 1.309 1.00 Gains on disposal of spectrum en Tobivenes 44.00 43310 4061 Changinapatikanities Operating expenses Accelerosivable 180111 Euture Aurreceiables (1.013) (1.9981 118121 Cost of services, exclusive of depresion and mortization stown separately below 6,023 (309 6.100 (617) Cost of equipment sales.exclusive depreciation and ametization shoor separately below Octus les causes ILANO 1.996 12.047 16 Other current and Internet 1181 Sisi Selling and administrative 14,139 13.161 12.10 Assouls avall Belishildis 17 1070 Depreciation and mortation 615 1964 Slavet and long-term operating loue liabilities (2.131 Coins ont la peine Se 44 Oher current and long terbaits 12131 be Other 52 Totale 1919 TR001 15216 Nel cavall parts 6,524 3.899 3.811 Operating income 5.12) S14 Investing nettsides XAN consolroperty and including dat SATI, SIA! and it 11 2171 Other inname experie) Purchase or specirun licenses and the inanghals, including cupsis 1957) 11271 15.828 Intersteepers (121) 18151 11,111) mitted inr miles fier sis 13 Proceeds to beneficial interests in Sections 3.576 4319 limisperioaffic INI) Nestandard in der under exchange Inies incum 19 Acquisiton of companies net of cash acquired ISINI Other pros al 1) 1941 Clerc 21 Tualeterapi 15191 675 (1.119 11.392 Net cashed in investing activities 11,727) F Fairvies Inerte here 4.NI! 3,161 Incum as lexpertech berci Proceed from swipuneraliilis 1,375 2,340 1365 Reporters of revolving credit they (6,3651 12.9101 Net income 1469 Reporters of financirglar shligaties Dividends on preferred neck Repayment of shariam dich feudanes olivenleyperly anal and Rep of long-term debe 3001 1020 Net ircnet weder $ 1:46 25 44RI W! Repurchases of common stock ( 19271 Tax wkolines on suure based awards 1136 11401 1160 $ 1.46 Dividends are $ 1551 Other comprende che imme, unul fax Gul penis fur de parlerliyilmer ereli 1158 152 mai in villages, nes abus discursul Net cushed in tinting activits CUTI 4330 1307 Change in each cuivalent hadial brondwhals, notex lectus IT) 5015 anal 0 12.5 in (9351 (312 Cupheash quivalents Cherie A 13121 Begingo parlod 1.NO INO End of S Total comercrive income 2.932 1,528 S 1219 2.556 Supplemental disclosure of cash How information Earn perre Interest paymers, tot amounts cap S 5 1.1285 1,525 $ 2028 Basic S 405S 3.40 5 9.39 pumily wrmit '' 2, In this 5! Dwied 11 S 4025 . 5.31 Non-cash investing and financing activities Waghted average shar sutstanding Nim-ced hencheidinkra blandit scharge for sure nacivables $ $ 4,50 S 492 $ 4053 811S (Decrease increase in culpable Sor purchases of retty and equipment 1935) 65 313 313 863431,911 888 2014 Druid 1,011 Lexed deres transferred from two to property and equipment 89136749 1.11 Retumed lessed devices carstered trom property and equipment to inventory 13261 17421 Short-ter desumed for finding of property and cauiem The accompanying notes are an integral part of these Consolidated Financial Statements Operatinelasenahof-use sets obtined in exchange for lease oblations 3.0 Firenciry large this in charges 1.041 867 (L) On lumay , 2019, we adopted Accounting Sandards Update (ASU) 2015-02, "Leases (Topk 82" which requires cercan supplement cash flow dsclosures Where these disclosures or a comparable figure were not required under the former leise udud, we have to trospecdvely presented Tiskarkust. See Note. Suntury of Significant Account Policies for additional details. 0 Other The accompanying nose an integral of the Calidate Financial Statements. 58 59 T-Mobile US, Inc. Consolidated Statement of Stockholders' Equity Par Value and Accumulated Preferred Common Treasury Additional Other Total Stock Stock Shares at Paid-in Comprehensive Accumulated Stockholders' (in millions, except shares) Outstanding Outstanding Cost Capital Loss Deficit Equity Balance as of December 31, 2016 20,000,000 826,357,331 S (1) S 38,846 $ 1 S (20,610) $ 18,236 Net income 4,536 4,536 Other comprehensive income 7 7 Stock-based compensation 344 344 Exercise of stock options 450,493 19 19 Stock issued for employee stock purchase plan 1,832,043 82 82 Issuance of vested restricted stock units 8,338,27 Shares withheld related to net share settlement of stock awards and stock options (2,754,721) (166) (166) Mandatory conversion of preferred shares to common shares (20,000,000) 32,237,983 Repurchases of common stock (7,010,889) (444) Transfer RSU to NODC plan (43.860) (3) 3 Dividends on preferred stock (55) (55) Balance as of December 31, 2017 859.406,651 (4) 38,629 8 (16,074) 22.559 Net income 2.888 2.888 Other comprehensive less (332) (332) Stock-based compensation 473 473 Exercise of stock options 187,965 3 3 3 Stock issued for employee stock purchase plan 2,011,794 103 103 Issuance of vested restricted stock units 7,448,148 Issuance of restricted stock awards 225,799 - Shares withheld related to net share settlement of stock awards and stock options (2.321,827) (146) (146) Repurchases of common stock (16,738,758) (1,054) (1.054) Transfer RSU from NQDC plan (39,455) (2) 2 Prior year Retained Earnings (8) 232 224 Balance as of December 31, 2018 850.180,317 (6) 38.010 (332) (12.954) 24,718 Net income 3,468 3,468 Other comprehensive loss (536) (536) Stock-based compensation 517 517 Exercise of stock options 85,083 1 1 Stock issued for employee stock purchase plan 2,091,650 124 124 Issuance of vested restricted stock units 6,685,950 Forfeiture of restricted stock awards (24,682) Shares withheld related to net share settlement of stock awards and stock options (2,094,555) (156) (156) Transfer RSU from NQDC plan (18,363) (2) 2 Prior year Retained Earnings 653 653 Balance as of December 31, 2019 856,905,400 S (8) S 38.498 $ (868) S (8,833) S 28,789 (1) Prior year Retained Eurnings represents the impact of the adoption of new accounting standards on beginning Accumulated Deficit and Accumulated Other Comprehensive Loss See Note 1 - Summary of Significant Accounting Policies for further information, The accompanying notes are an integral part of these Consolidated Financial Statements 60 Consolidated Balance Sheets Dollars in millions except per share amounts December 31, 2019 2018 Assets Current Assets Cash and cash equivalents Accounts receivable - net of allowances for doubtful accounts of $1,235 and $907 Prepaid expenses Other current assets Total current assets Noncurrent inventories and theatrical film and television production costs Property, Plant and Equipment - Net Goodwill Licenses - Net Trademarks and Trade Names - Net Distribution Networks - Net Other Intangible Assets - Net Investments in and Advances to Equity Affiliates Operating lease right-of-use assets Other Assets Total Assets $ 12,130 22,636 1,631 18,364 54,761 12,434 130,128 146,241 97,907 23,567 15,345 20,798 3,695 24,039 22,754 $551,669 $ 5,204 26,472 2,047 17,704 51,427 7,713 131,473 146,370 96,144 24,345 17,069 26,269 6,245 24,809 $531,864 $ 11,838 45,956 6,124 1,212 3,781 68,911 151,309 $ 10,255 43,184 5,948 1,179 3,854 64,420 166,250 57,859 19,218 59,502 18,788 21,804 29,421 129,515 30,233 107,310 Liabilities and Stockholders' Equity Current Liabilities Debt maturing within one year Accounts payable and accrued liabilities Advanced billings and customer deposits Accrued taxes Dividends payable Total current liabilities Long-Term Debt Deferred Credits and Other Noncurrent Liabilities Deferred income taxes Postemployment benefit obligation Operating lease liabilities Other noncurrent liabilities Total deferred credits and other noncurrent liabilities Stockholders' Equity Preferred stock ($1 par value, 5% cumulative, 10,000,000 authorized, 48,000 shares issued and outstanding at December 31, 2019 and O issued and outstanding at December 31, 2018) Common stock ($1 par value, 14,000,000,000 authorized at December 31, 2019 and December 31, 2018: issued 7,620,748,598 at December 31, 2019 and at December 31, 2018) Additional paid-in capital Retained earnings Treasury stock (366,193,458 at December 31, 2019 and 339,120,073 at December 31, 2018, at cost) Accumulated other comprehensive income Noncontrolling interest Total stockholders' equity Total Liabilities and Stockholders' Equity The accompanying notes are an integral part of the consolidated financial statements 7,621 126,279 57,936 7,621 125,525 58,753 (13,085) 5,470 17,713 201,934 $551,669 (12,059) 4,249 9,795 193,884 $531,864 52 s of Cash Flows Changes in Stockholders' Equity Shores Amount shersAmount Shanes **** Aroun $ 14,975 7,621 $ 7,623 7,621 $ 7,621 $125,825 6,495 $ 6.495 7.621 $ 7621 1956 - 1115 S - 6,495 S 6495 6,495 $ 6495 $ 89.604 129 2 Acquistion of interest $126.979 125 525 $50500 $ 89,563 $ 34,734 29,450 $ 58,753 13,903 (15,026) 43602 38.010 19.370 (14 1171 112.157 of cash could 16 E87 90.500 (2,492 1201692 1307 ca651 2365112716 (16,690) 163145 HERBA mprehensive Income iginal maturities $4249 2010 s attributable to ATAT 1930 $ 5,470 $ 9,795 7,876 (1,055 (9) 151 Cumulative effect of Balance at end of year Total, Stockholders' Equity at beginning of Total Stockholders Equity at end of year $ 11,719 $193,884 $142007 $201,934
Step by Step Solution
There are 3 Steps involved in it
Step: 1

Get Instant Access to Expert-Tailored Solutions
See step-by-step solutions with expert insights and AI powered tools for academic success
Step: 2

Step: 3
Ace Your Homework with AI
Get the answers you need in no time with our AI-driven, step-by-step assistance
Get Started
Standard For Auditing Computer Applications
Authors: Martin A. Krist
2nd Edition
0849399831, 978-0849399831