

Question
Instructions: Part A: Create pro forma financial statements. This spreadsheet is set up so that green cells contain numbers and white cells contain formulas. Follow
Instructions:
Part A: Create pro forma financial statements.
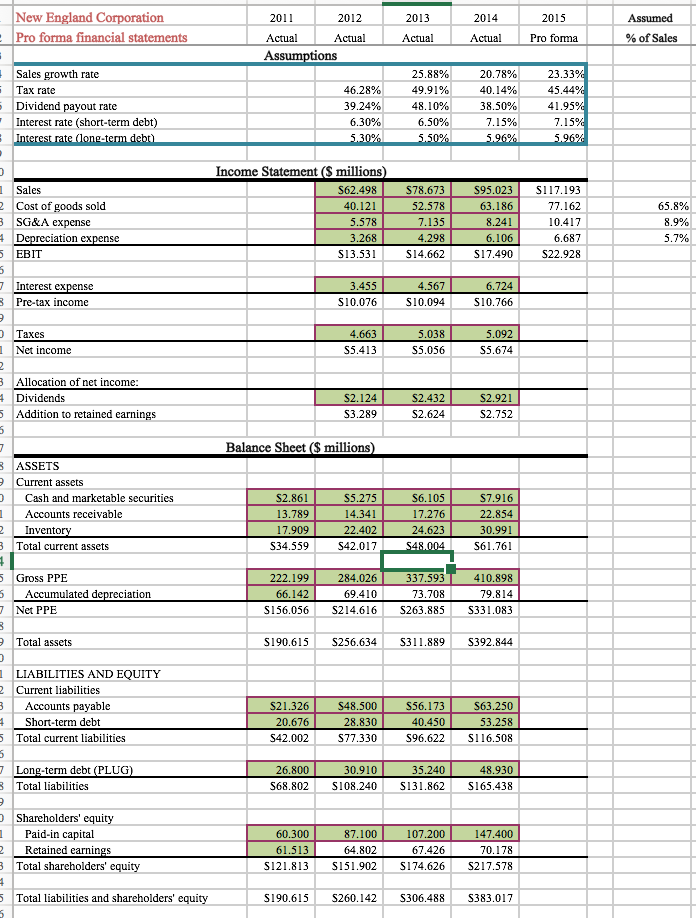
This spreadsheet is set up so that green cells contain numbers and white cells contain formulas. Follow the steps below to prepare pro formas for 2015, assuming that New England Corp. will make up any funding shortfall with long-term debt and will use any funding surplus to pay down long-term debt (i.e., let long-term debt be the plug figure).
1. As a starting point, assume that sales growth in 2015 will be equal to the average sales growth for 2013 and 2014. Enter the formula for this assumption in the Assumptions section, and then enter the formula for projected sales in 2015.
2. For all financial statement items that would be expected to vary with sales, use the historical average over the past three years of the ratio of that item to sales as a projection of the percentage of sales for 2015. I suggest that you enter these percentages in the column on the right Assumed % of Sales. (Hint: If you enter your formula correctly in one cell, locking in the appropriate references, then you can simply copy and paste the formula to other cells.) Having this column allows you to return and change the assumption for these items later on. For simplicity, in addition to items that typically vary as a percentage of sales, also assume that depreciation expense, Gross PPE, and short-term debt vary as a percentage of sales.
3. Fill in the 2015 forecast for each item that would be expected to vary with sales. (Again, if you enter the formula correctly, you can copy and paste it to other cells.)
4. Fill in all cells in the 2015 forecast that are just formulas (e.g., pre-tax income is just EBIT interest expense).
5. Fill in the other items that would not be expected to vary with sales, that is, everything else except for long-term debt. Assumptions for the tax rate, dividend payout rate, and interest rates should be made above in the Assumptions section. For the tax rate and dividend payout rate assume a 2015 projection equal to the average of the previous three years. Assume that interest rates will remain the same as the previous year.[1] Also, assume no new equity will be issued in 2015.
6. Fill in long-term debt as the plug figure. This will be the balancing item that makes assets = liabilities + equity, but dont enter the formula as total assets (total liabilities + equity) or you will get a circular reference (one that cant be remedied with iterative calculation). Instead, you need to make the formula be total assets current liabilities total equity. This will balance the balance sheet and not be circular.
Q1: Under the assumptions outlined above, what level of long-term debt will be required by New England Corporation in 2015? _________________
Q2: What is projected net income for New England in 2015? _________________
Step by Step Solution
There are 3 Steps involved in it
Step: 1

Get Instant Access to Expert-Tailored Solutions
See step-by-step solutions with expert insights and AI powered tools for academic success
Step: 2

Step: 3
Ace Your Homework with AI
Get the answers you need in no time with our AI-driven, step-by-step assistance
Get Started
Personal Finance
Authors: Jack R Kapoor, Glencoe McGraw Hill, Les R Dlabay, Robert J Hughes
1st Edition
0078698006, 9780078698002