Answered step by step
Verified Expert Solution
Link Copied!

Question

1 Approved Answer

Instructions: Read the attached CER carefully, and examine the attached spreadsheets. Identify the mistakes made in the spreadsheet and CER write-up. Re-do the spreadsheets to

Instructions:

  1. Read the attached CER carefully, and examine the attached spreadsheets.
  2. Identify the mistakes made in the spreadsheet and CER write-up.
  3. Re-do the spreadsheets to reflect the correct numbers to be used in the calculations.
  4. Re-do the CER write-up after correcting the mistakes in the Excel files.

Points awarded:

  1. Correctly identify at least 10 mistakes in the spreadsheet and write-up:
  2. Re-do the spreadsheets with correct calculations:
  3. Re-do the CER write-up to reflect the correct answers generated by the revised Excel spreadsheets:

Project Description:

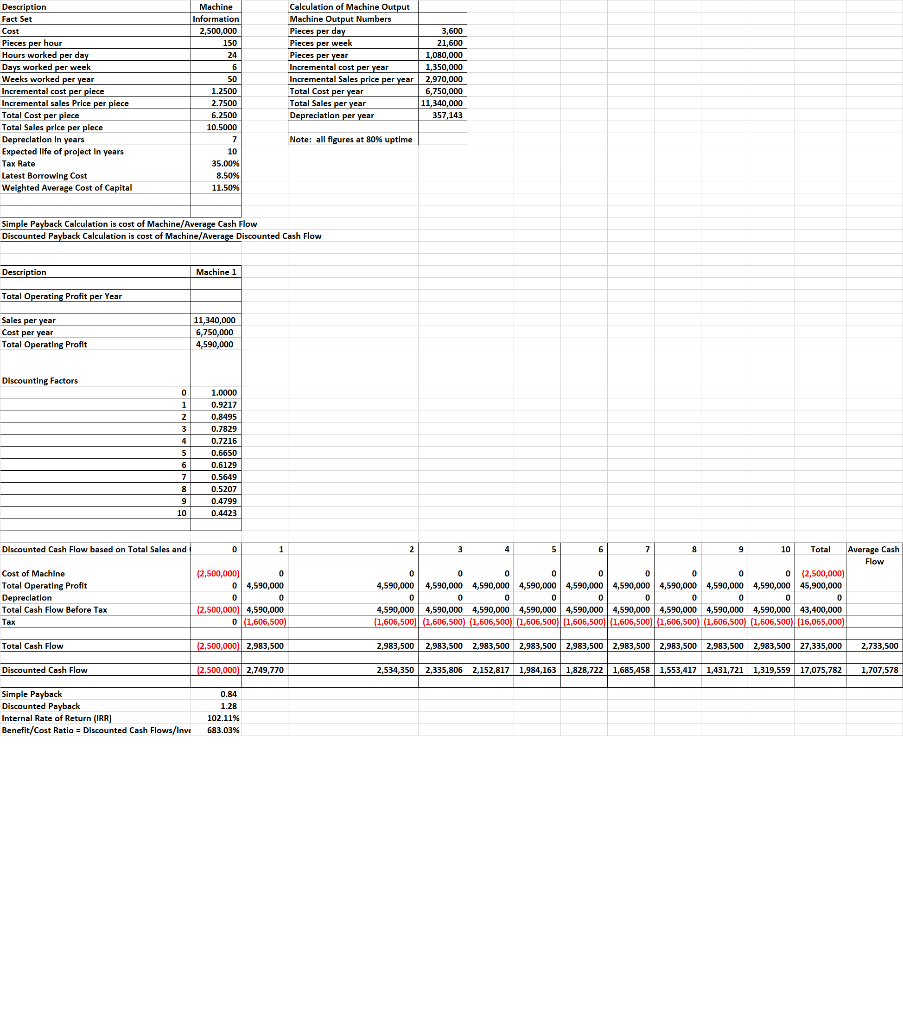
Excel Manufacturing Company is the premier manufacturer of computer drive assemblies in the world. In order for our manufacturing processes to remain state-of-the-art, we must invest in new technology on a continuing basis. The current CER is submitted to provide justification for a new machine that will automate several discrete processes. Currently, we die stamp an assembly, then manually insert various electronic components to the assembly. This process is time-consuming and labor intensive.

By spending $2,500,000 on a new piece of production equipment, we will be able to eliminate the time-consuming manual assembly process, resulting in an output of 150 pieces per hour at 80% uptime, which is an improvement over our current process. As a result of the investment in this machine, the company will achieve total operating profits of approximately $4.6 million per year. This increase in operating profit will result in significant after tax savings, and will drive net income to new levels. As we are all aware, net income is the most important measurement of management success and is the primary factor which determines our increasing stock price.

The machine will be depreciated over a period of 7 years on a straight-line basis, and the project is expected to have a 10-year useful life. Depreciation expense has been included in calculating operating profits.

Project Savings:

As a result of this project, we will have sales of $11,340,000 for this assembly line and operating profits of $4,590,000 per year as mentioned above. We have discounted the cash flows resulting from this project using our latest borrowing costs of 8.5%, which is less than our weighted average cost of capital of 11.5%. We believe that the latest borrowing cost is more representative of the interest rate that we would be charged with on a go-forward basis, and is therefore more representative than using the weighted average cost of capital.

Discounted cash flow: $2,167,000 per year

Discounted cash flow, life of project: $27,335,000

Annual depreciation expense: $357,143 over 7 years

Discount Rate: 8.5%

Simple payback: .84 years

Discounted payback: 1.28 years.

Internal Rate of Return: 102.11%

Recommendation:

Due to the intense competitive pressures we face at Excel Manufacturing, it is in our best interests to constantly invest in new equipment and manufacturing processes. The current proposal will significantly increase our productive capacity, as well as provide increased sales and profits for the company. The IRR of the project is exceptional, and will boost the companys long-term return on assets, which is currently 25%. The expected payback is well within our stated goals of a 2-1/2-year simple payback and a 5-year discounted payback. The machines useful life will extend to 10 years, and will allow us to remain ahead of the competition for that period of time. We recommend that the management team approve this project

image text in transcribed

Description Fact Set Cost Pieces per hour Hours worked per day Days worked per week Weeks worked per year Incremental cost per piece Incremental sales Price per plece Total Cost per plece Total Sales price per place Depreciation In years Expected life of project in years Tax Rate Latest Borrowing Cost Weighted Average Cost of Capital Machine Information 2,500,000 150 24 6 50 1.2500 2.7500 6.2500 10.5000 7 10 35.00% 8.50% 11.50% Calculation of Machine Output Machine Output Numbers Pieces per day 3,600 Pieces per week 21,600 Pieces per year 1,080,000 Incremental cost per year 1.350.000 Incremental Sales price per year 2,970,000 Total Cost per year 6,750,000 Total Sales per year 11,340,000 Depreciation per year 357,143 Note: all figures at 80% uptime Simple Payback Calculation is cost of Machine/Average Cash Flow Discounted Payback Calculation is cost of Machine/Average Discounted Cash Flow Description Machine 1 Total Operating Profit per Year Sales per year Cost per year Total Operating Profit 11,340,000 6,750,000 4,590,000 Discounting Factors 0 1 2 3 3 4 5 6 7 7 8 9 10 1.0000 0.9217 0.8495 0.7829 0.7216 0.6650 0.6129 0.5649 0.5207 0.4799 0.4423 Discounted Cash Flow based on Total Sales and 0 1 Cost of Machine Total Operating Profit Depreciation Total Cash Flow Before Tax Tax 12,500,000) 0 0 4,590,000 0 0 12,500,000 4,590,000 0 (1,606,500) 2 3 4 5 6 7 8 9 10 Total Average Cash Flow 0 0 0 0 0 0 0 0 0 (2,500,000) o 4,590,000 4,590,000 4,590,000 4,590,000 4,590,000 4,590,000 4,590,000 4,590,000 4,590,000 45,900,000 D 0 0 0 0 0 0 0 0 0 4,590,000 4,590,000 4,590,000 4,590,000 4,590,000 4,590,000 4,590,000 4,590,000 4,590,000 43,400,000 (1,606,500) (1,606,500) (1,606,500) (1,606,500) (1,606,500) (1,606,500) (1,606,500) (1,606,500) (1,606,500) (16,065,000) Total Cash Flow 12.500.000) 2,983,500 2,983,500 2,983,500 2,983,500 2,983,500 2,983,500 2,983,500 2,983,500 2,983,500 2,983,500 27,335,000 2,733,500 Discounted Cash Flow () 12.500.000|| 2.749.770 2,534,350 2,335,806 2.152,817 1,984,163 1,828,722 1,685,458 1,553,417 1,431,721 1,319,559 17,075,782 1,707,578 Simple Payback Discounted Payback Internal Rate of Return (IRR) Benefit/Cost Ratio = Discounted Cash Flows/Inve 0.84 1.28 102.11% 683.03% Description Fact Set Cost Pieces per hour Hours worked per day Days worked per week Weeks worked per year Incremental cost per piece Incremental sales Price per plece Total Cost per plece Total Sales price per place Depreciation In years Expected life of project in years Tax Rate Latest Borrowing Cost Weighted Average Cost of Capital Machine Information 2,500,000 150 24 6 50 1.2500 2.7500 6.2500 10.5000 7 10 35.00% 8.50% 11.50% Calculation of Machine Output Machine Output Numbers Pieces per day 3,600 Pieces per week 21,600 Pieces per year 1,080,000 Incremental cost per year 1.350.000 Incremental Sales price per year 2,970,000 Total Cost per year 6,750,000 Total Sales per year 11,340,000 Depreciation per year 357,143 Note: all figures at 80% uptime Simple Payback Calculation is cost of Machine/Average Cash Flow Discounted Payback Calculation is cost of Machine/Average Discounted Cash Flow Description Machine 1 Total Operating Profit per Year Sales per year Cost per year Total Operating Profit 11,340,000 6,750,000 4,590,000 Discounting Factors 0 1 2 3 3 4 5 6 7 7 8 9 10 1.0000 0.9217 0.8495 0.7829 0.7216 0.6650 0.6129 0.5649 0.5207 0.4799 0.4423 Discounted Cash Flow based on Total Sales and 0 1 Cost of Machine Total Operating Profit Depreciation Total Cash Flow Before Tax Tax 12,500,000) 0 0 4,590,000 0 0 12,500,000 4,590,000 0 (1,606,500) 2 3 4 5 6 7 8 9 10 Total Average Cash Flow 0 0 0 0 0 0 0 0 0 (2,500,000) o 4,590,000 4,590,000 4,590,000 4,590,000 4,590,000 4,590,000 4,590,000 4,590,000 4,590,000 45,900,000 D 0 0 0 0 0 0 0 0 0 4,590,000 4,590,000 4,590,000 4,590,000 4,590,000 4,590,000 4,590,000 4,590,000 4,590,000 43,400,000 (1,606,500) (1,606,500) (1,606,500) (1,606,500) (1,606,500) (1,606,500) (1,606,500) (1,606,500) (1,606,500) (16,065,000) Total Cash Flow 12.500.000) 2,983,500 2,983,500 2,983,500 2,983,500 2,983,500 2,983,500 2,983,500 2,983,500 2,983,500 2,983,500 27,335,000 2,733,500 Discounted Cash Flow () 12.500.000|| 2.749.770 2,534,350 2,335,806 2.152,817 1,984,163 1,828,722 1,685,458 1,553,417 1,431,721 1,319,559 17,075,782 1,707,578 Simple Payback Discounted Payback Internal Rate of Return (IRR) Benefit/Cost Ratio = Discounted Cash Flows/Inve 0.84 1.28 102.11% 683.03%

Step by Step Solution

There are 3 Steps involved in it

Step: 1

blur-text-image

Get Instant Access to Expert-Tailored Solutions

See step-by-step solutions with expert insights and AI powered tools for academic success

Step: 2

blur-text-image

Step: 3

blur-text-image

Ace Your Homework with AI

Get the answers you need in no time with our AI-driven, step-by-step assistance

Get Started

Recommended Textbook for

Factory Business System Audit Lean Manufacturing

Authors: Rolf Thorsten

1st Edition

1091908583, 978-1091908581

More Books

Students also viewed these Accounting questions