Question
Instructions: Select the best XLSTAT printout to answer each question. Assume all required conditions have been met for each question. A significance level of =
Instructions: Select the best XLSTAT printout to answer each question. Assume all required conditions have been met for each question. A significance level of = 0.05 is used for each hypothesis test and a confidence level of 95% is used for each confidence interval estimate. Your solution should be this document with all the blanks filled in. No calculations are necessary. Note that 2 printouts will remain unselected. Write the hypotheses the same way they are given in the learning modules or textbook. Upload your solution in the Assignments folder before 11:59pm on March 28.
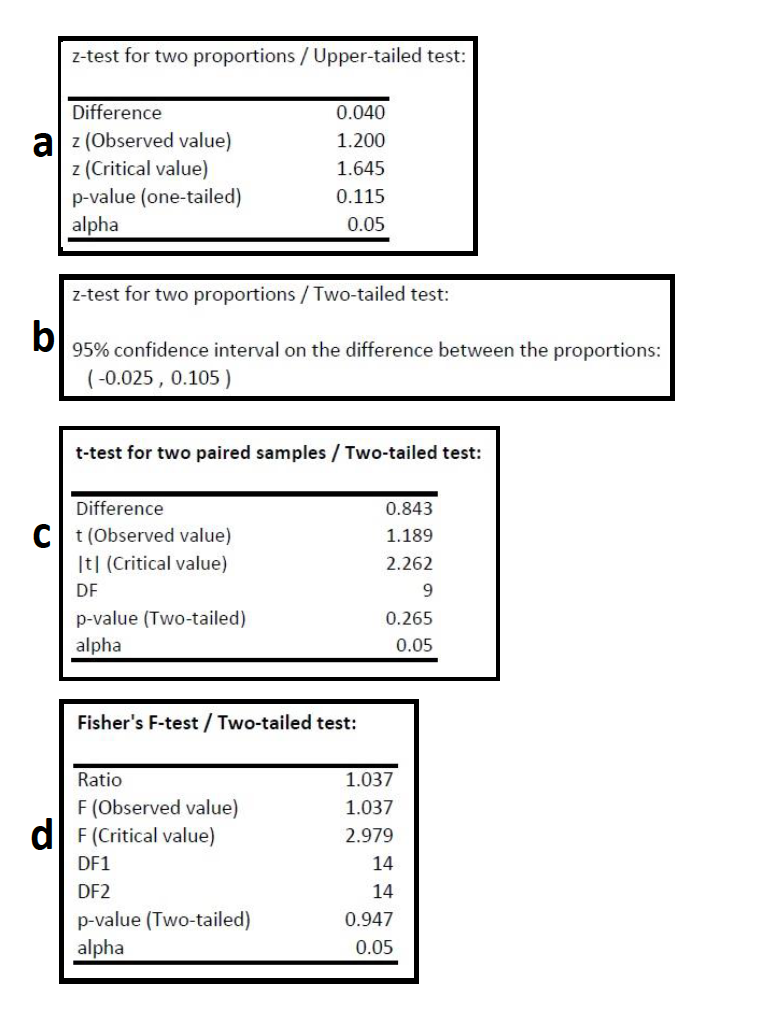
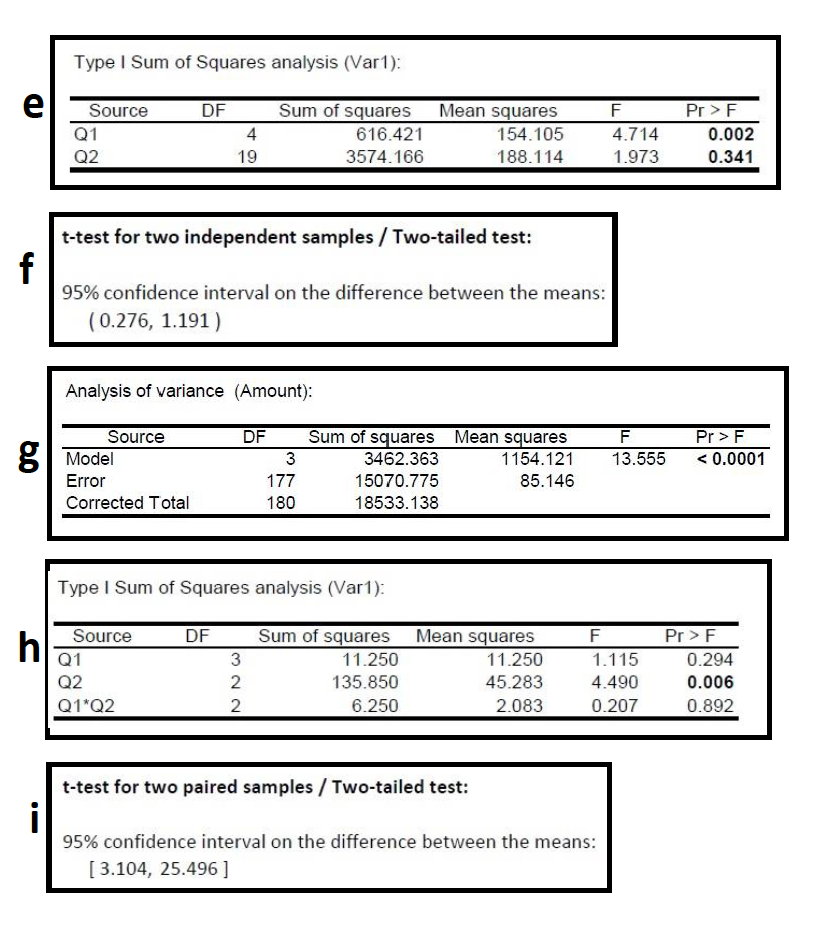
2. Two jam producers produce jars of strawberry jam. Jars from each producer are weighed and the weights are recorded. Can we infer that the variance in jam jar weights differs between the jam producers? 13 marks
Printout # ___________________ : ________________________ : ________________________
01
p-value: _____________ Conclusion: Reject 0 Do not reject 0
z-test for two proportions / Upper-tailed test: Difference az (Observed value) z (Critical value) p-value (one-tailed) alpha 0.040 1.200 1.645 0.115 0.05 z-test for two proportions / Two-tailed test: b 95% confidence interval on the difference between the proportions: (-0.025, 0.105) t-test for two paired samples / Two-tailed test: Difference Ct(Observed value) It (Critical value) DF p-value (Two-tailed) alpha 0.843 1.189 2.262 9 0.265 0.05 Fisher's F-test / Two-tailed test: Ratio F (Observed value) d) F (Critical value) DF1 DF2 p-value (Two-tailed) alpha 1.037 1.037 2.979 14 14 0.947 0.05 Type I Sum of Squares analysis (Var): e DF Source Q1 Q2 4 19 Sum of squares 616.421 3574.166 Mean squares 154.105 188.114 F 4.714 1.973 Pr>F 0.002 0.341 t-test for two independent samples / Two-tailed test: f 95% confidence interval on the difference between the means: (0.276, 1.191 ) Analysis of variance (Amount): Source g Model Pr>F F 0.294 0.006 0.892 NN t-test for two paired samples / Two-tailed test: i 95% confidence interval on the difference between the means: [3.104, 25.496] z-test for two proportions / Upper-tailed test: Difference az (Observed value) z (Critical value) p-value (one-tailed) alpha 0.040 1.200 1.645 0.115 0.05 z-test for two proportions / Two-tailed test: b 95% confidence interval on the difference between the proportions: (-0.025, 0.105) t-test for two paired samples / Two-tailed test: Difference Ct(Observed value) It (Critical value) DF p-value (Two-tailed) alpha 0.843 1.189 2.262 9 0.265 0.05 Fisher's F-test / Two-tailed test: Ratio F (Observed value) d) F (Critical value) DF1 DF2 p-value (Two-tailed) alpha 1.037 1.037 2.979 14 14 0.947 0.05 Type I Sum of Squares analysis (Var): e DF Source Q1 Q2 4 19 Sum of squares 616.421 3574.166 Mean squares 154.105 188.114 F 4.714 1.973 Pr>F 0.002 0.341 t-test for two independent samples / Two-tailed test: f 95% confidence interval on the difference between the means: (0.276, 1.191 ) Analysis of variance (Amount): Source g Model Pr>F F 0.294 0.006 0.892 NN t-test for two paired samples / Two-tailed test: i 95% confidence interval on the difference between the means: [3.104, 25.496]Step by Step Solution
There are 3 Steps involved in it
Step: 1
Get Instant Access to Expert-Tailored Solutions
See step-by-step solutions with expert insights and AI powered tools for academic success
Step: 2
Step: 3
Ace Your Homework with AI
Get the answers you need in no time with our AI-driven, step-by-step assistance
Get Started