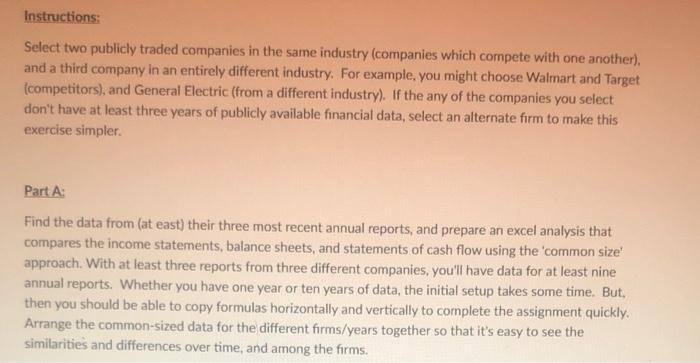
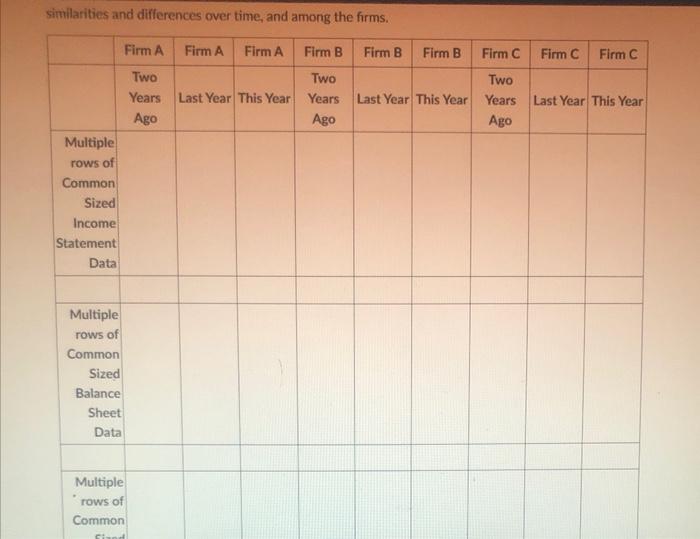
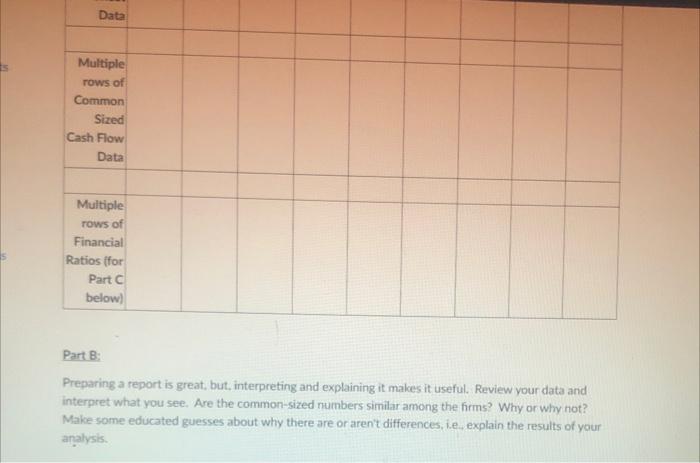
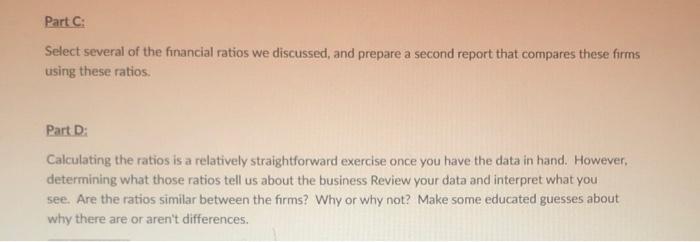
Instructions: Select two publicly traded companies in the same industry (companies which compete with one another), and a third company in an entirely different industry. For example, you might choose Walmart and Target (competitors), and General Electric (from a different industry). If the any of the companies you select don't have at least three years of publicly available financial data, select an alternate firm to make this exercise simpler Part A: Find the data from (at east) their three most recent annual reports, and prepare an excel analysis that compares the income statements, balance sheets, and statements of cash flow using the 'common size' approach. With at least three reports from three different companies, you'll have data for at least nine annual reports. Whether you have one year or ten years of data, the initial setup takes some time. But, then you should be able to copy formulas horizontally and vertically to complete the assignment quickly. Arrange the common-sized data for the different firms/years together so that it's easy to see the similarities and differences over time, and among the firms. similarities and differences over time, and among the firms. Firm A Firm A Firm A Firm B Firm B Firm B Firm C Firm C Firm C Two Last Year This Year Two Years Last Year This Year Ago Years Last Year This Year Ago Two Years Ago Multiple rows of Common Sized Income Statement Data Multiple rows of Common Sized Balance Sheet Data Multiple Tows of Common Si Data Multiple rows of Common Sized Cash Flow Data Multiple rows of Financial Ratios (for Part below) Part B: Preparing a report is great, but, interpreting and explaining it makes it useful Review your data and interpret what you see. Are the common-sized numbers similar among the firms? Why or why not? Make some educated guesses about why there are or aren't differences, ie, explain the results of your analysis Part C: Select several of the financial ratios we discussed, and prepare a second report that compares these firms using these ratios. Part D: Calculating the ratios is a relatively straightforward exercise once you have the data in hand. However, determining what those ratios tell us about the business Review your data and interpret what you see. Are the ratios similar between the firms? Why or why not? Make some educated guesses about why there are or aren't differences. Instructions: Select two publicly traded companies in the same industry (companies which compete with one another), and a third company in an entirely different industry. For example, you might choose Walmart and Target (competitors), and General Electric (from a different industry). If the any of the companies you select don't have at least three years of publicly available financial data, select an alternate firm to make this exercise simpler Part A: Find the data from (at east) their three most recent annual reports, and prepare an excel analysis that compares the income statements, balance sheets, and statements of cash flow using the 'common size' approach. With at least three reports from three different companies, you'll have data for at least nine annual reports. Whether you have one year or ten years of data, the initial setup takes some time. But, then you should be able to copy formulas horizontally and vertically to complete the assignment quickly. Arrange the common-sized data for the different firms/years together so that it's easy to see the similarities and differences over time, and among the firms. similarities and differences over time, and among the firms. Firm A Firm A Firm A Firm B Firm B Firm B Firm C Firm C Firm C Two Last Year This Year Two Years Last Year This Year Ago Years Last Year This Year Ago Two Years Ago Multiple rows of Common Sized Income Statement Data Multiple rows of Common Sized Balance Sheet Data Multiple Tows of Common Si Data Multiple rows of Common Sized Cash Flow Data Multiple rows of Financial Ratios (for Part below) Part B: Preparing a report is great, but, interpreting and explaining it makes it useful Review your data and interpret what you see. Are the common-sized numbers similar among the firms? Why or why not? Make some educated guesses about why there are or aren't differences, ie, explain the results of your analysis Part C: Select several of the financial ratios we discussed, and prepare a second report that compares these firms using these ratios. Part D: Calculating the ratios is a relatively straightforward exercise once you have the data in hand. However, determining what those ratios tell us about the business Review your data and interpret what you see. Are the ratios similar between the firms? Why or why not? Make some educated guesses about why there are or aren't differences


