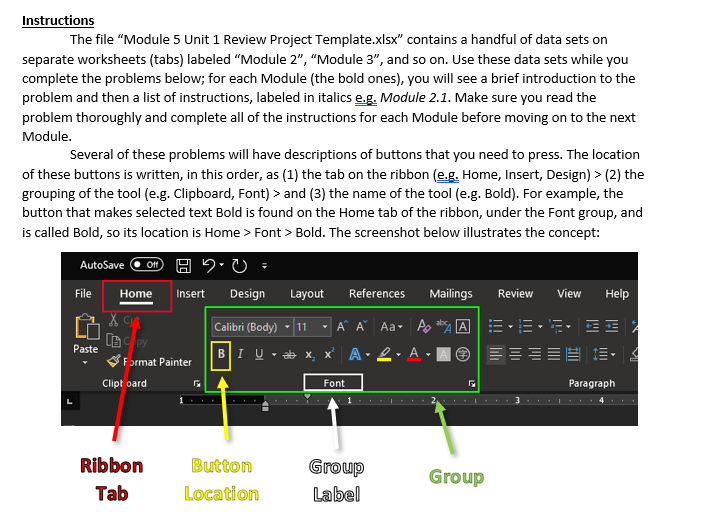
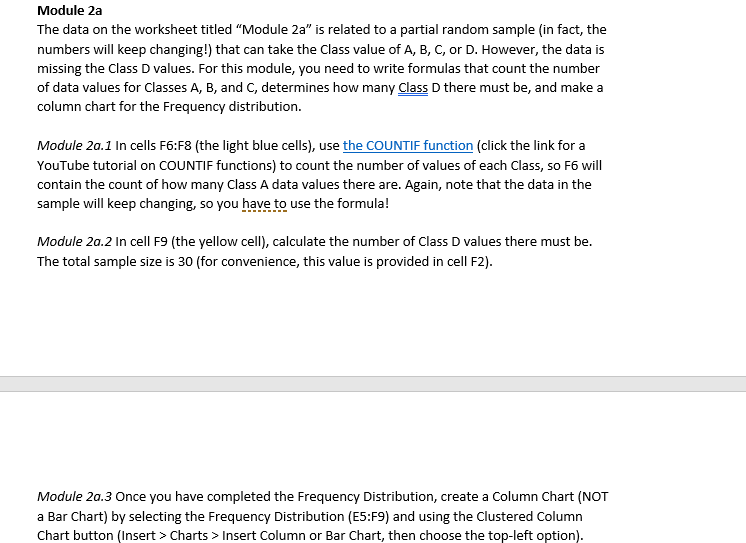
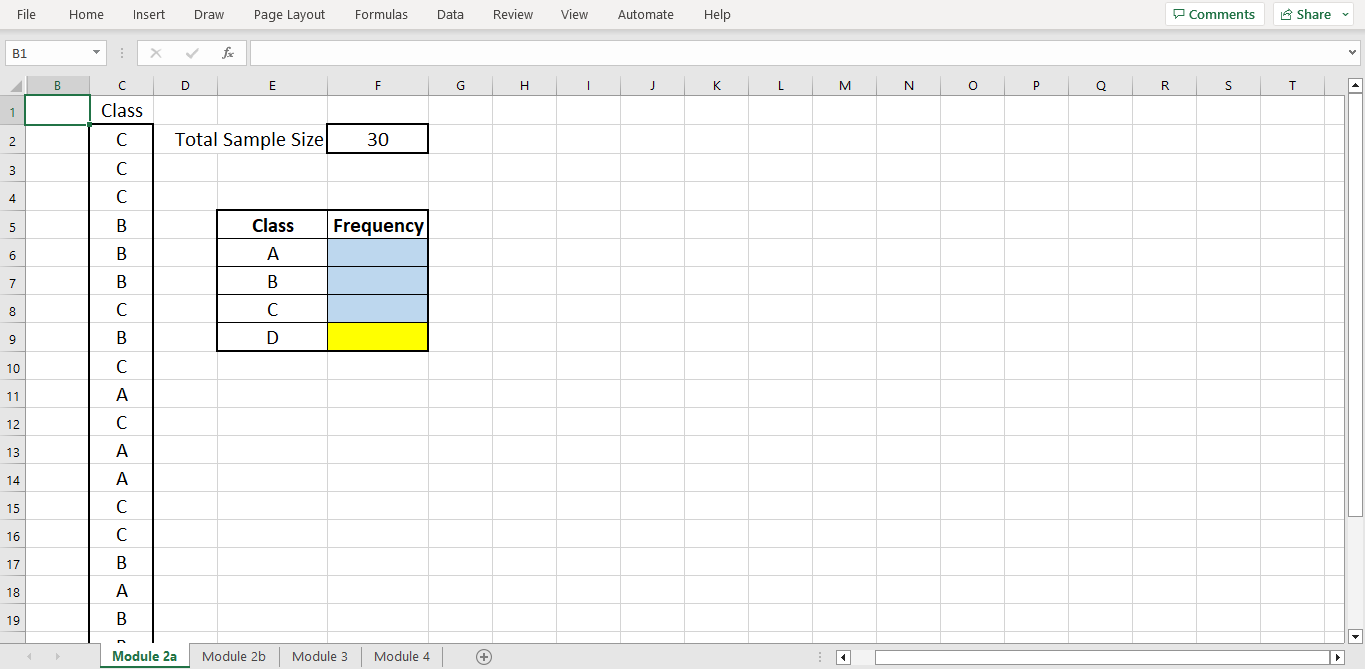
Instructions The file "Module 5 Unit 1 Review Project Template.xlsx" contains a handful of data sets on separate worksheets (tabs) labeled "Module 2 ", "Module 3 ", and so on. Use these data sets while you complete the problems below; for each Module (the bold ones), you will see a brief introduction to the problem and then a list of instructions, labeled in italics e.g. Module 2.1. Make sure you read the problem thoroughly and complete all of the instructions for each Module before moving on to the next Module. Several of these problems will have descriptions of buttons that you need to press. The location of these buttons is written, in this order, as (1) the tab on the ribbon (e.g. Home, Insert, Design) > (2) the grouping of the tool (e.g. Clipboard, Font) > and (3) the name of the tool (e.g. Bold). For example, the button that makes selected text Bold is found on the Home tab of the ribbon, under the Font group, and is called Bold, so its location is Home > Font > Bold. The screenshot below illustrates the concept: The data on the worksheet titled "Module 2a " is related to a partial random sample (in fact, the numbers will keep changing!) that can take the Class value of A, B, C, or D. However, the data is missing the Class D values. For this module, you need to write formulas that count the number of data values for Classes A, B, and C, determines how many Class D there must be, and make a column chart for the Frequency distribution. Module 2a.1 In cells F6:F8 (the light blue cells), use (click the link for a YouTube tutorial on COUNTIF functions) to count the number of values of each Class, so F6 will contain the count of how many Class A data values there are. Again, note that the data in the sample will keep changing, so you have to use the formula! Module 2a.2 In cell F9 (the yellow cell), calculate the number of Class D values there must be. The total sample size is 30 (for convenience, this value is provided in cell F2). Module 2a.3 Once you have completed the Frequency Distribution, create a Column Chart (NOT a Bar Chart) by selecting the Frequency Distribution (E5:F9) and using the Clustered Column Chart button (Insert > Charts > Insert Column or Bar Chart, then choose the top-left option). Instructions The file "Module 5 Unit 1 Review Project Template.xlsx" contains a handful of data sets on separate worksheets (tabs) labeled "Module 2 ", "Module 3 ", and so on. Use these data sets while you complete the problems below; for each Module (the bold ones), you will see a brief introduction to the problem and then a list of instructions, labeled in italics e.g. Module 2.1. Make sure you read the problem thoroughly and complete all of the instructions for each Module before moving on to the next Module. Several of these problems will have descriptions of buttons that you need to press. The location of these buttons is written, in this order, as (1) the tab on the ribbon (e.g. Home, Insert, Design) > (2) the grouping of the tool (e.g. Clipboard, Font) > and (3) the name of the tool (e.g. Bold). For example, the button that makes selected text Bold is found on the Home tab of the ribbon, under the Font group, and is called Bold, so its location is Home > Font > Bold. The screenshot below illustrates the concept: The data on the worksheet titled "Module 2a " is related to a partial random sample (in fact, the numbers will keep changing!) that can take the Class value of A, B, C, or D. However, the data is missing the Class D values. For this module, you need to write formulas that count the number of data values for Classes A, B, and C, determines how many Class D there must be, and make a column chart for the Frequency distribution. Module 2a.1 In cells F6:F8 (the light blue cells), use (click the link for a YouTube tutorial on COUNTIF functions) to count the number of values of each Class, so F6 will contain the count of how many Class A data values there are. Again, note that the data in the sample will keep changing, so you have to use the formula! Module 2a.2 In cell F9 (the yellow cell), calculate the number of Class D values there must be. The total sample size is 30 (for convenience, this value is provided in cell F2). Module 2a.3 Once you have completed the Frequency Distribution, create a Column Chart (NOT a Bar Chart) by selecting the Frequency Distribution (E5:F9) and using the Clustered Column Chart button (Insert > Charts > Insert Column or Bar Chart, then choose the top-left option)