Answered step by step
Verified Expert Solution
Question
1 Approved Answer
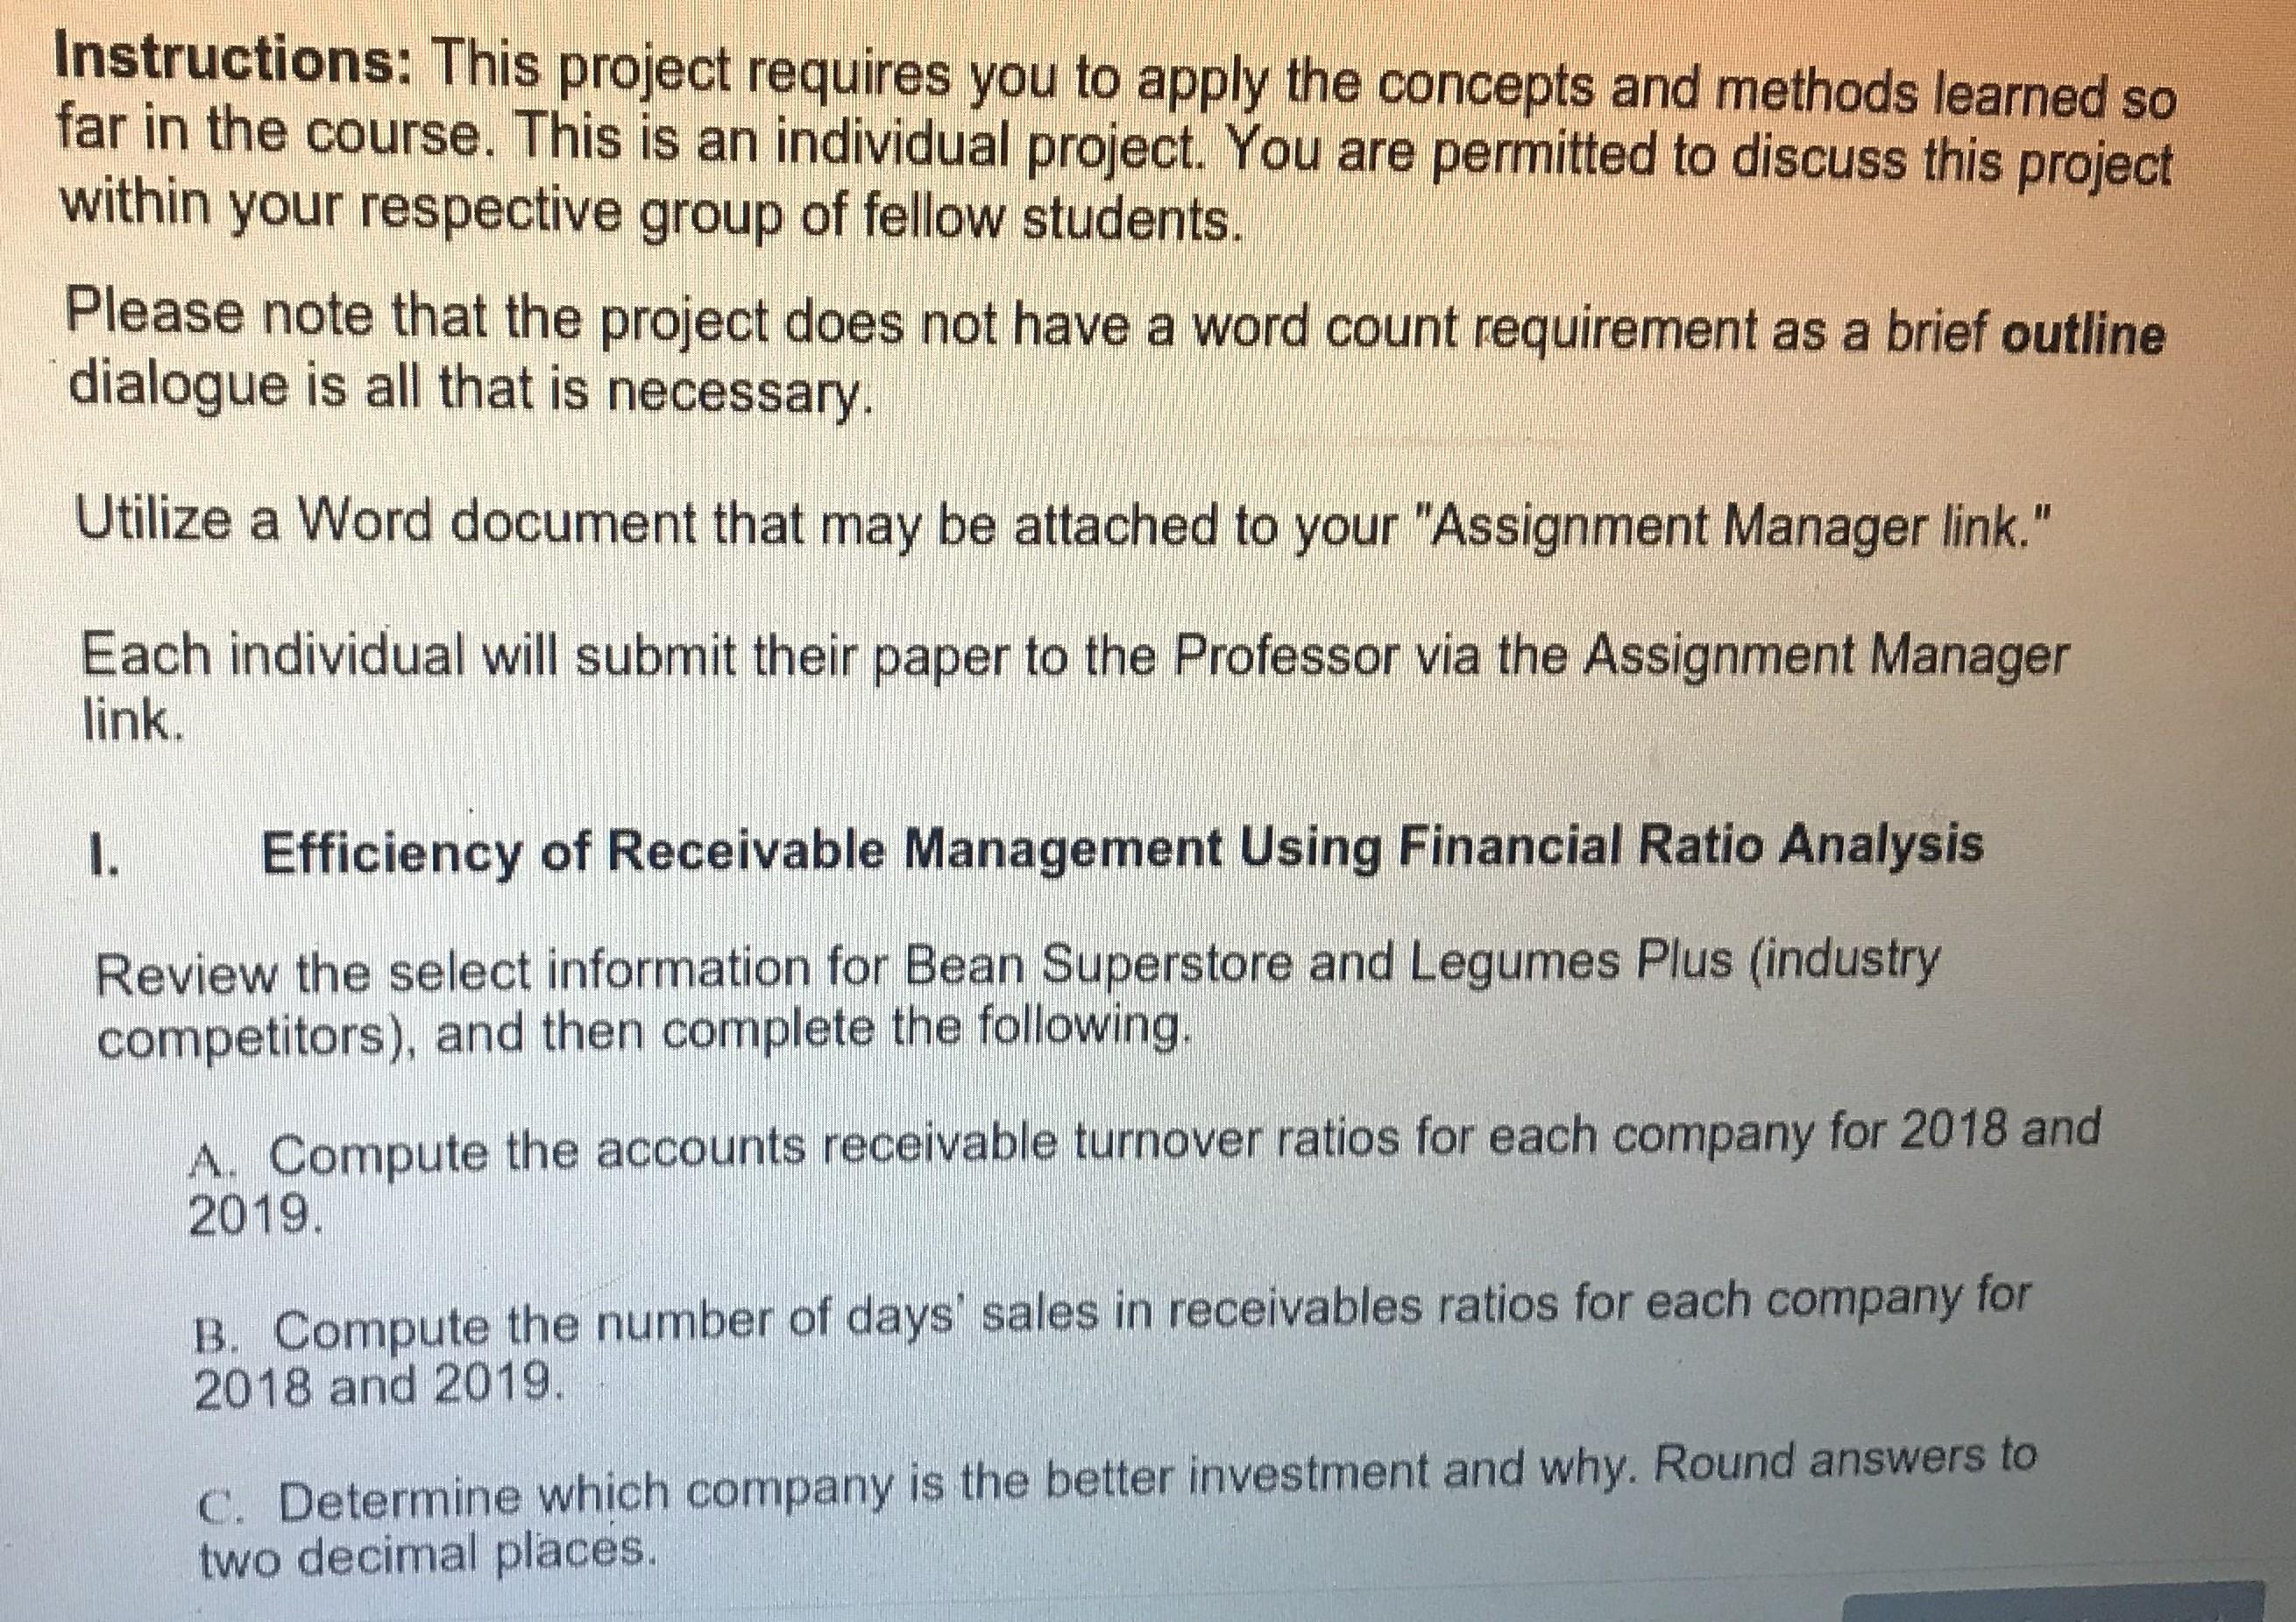
Instructions: This project requires you to apply the concepts and methods learned so far in the course. This is an individual project. You are


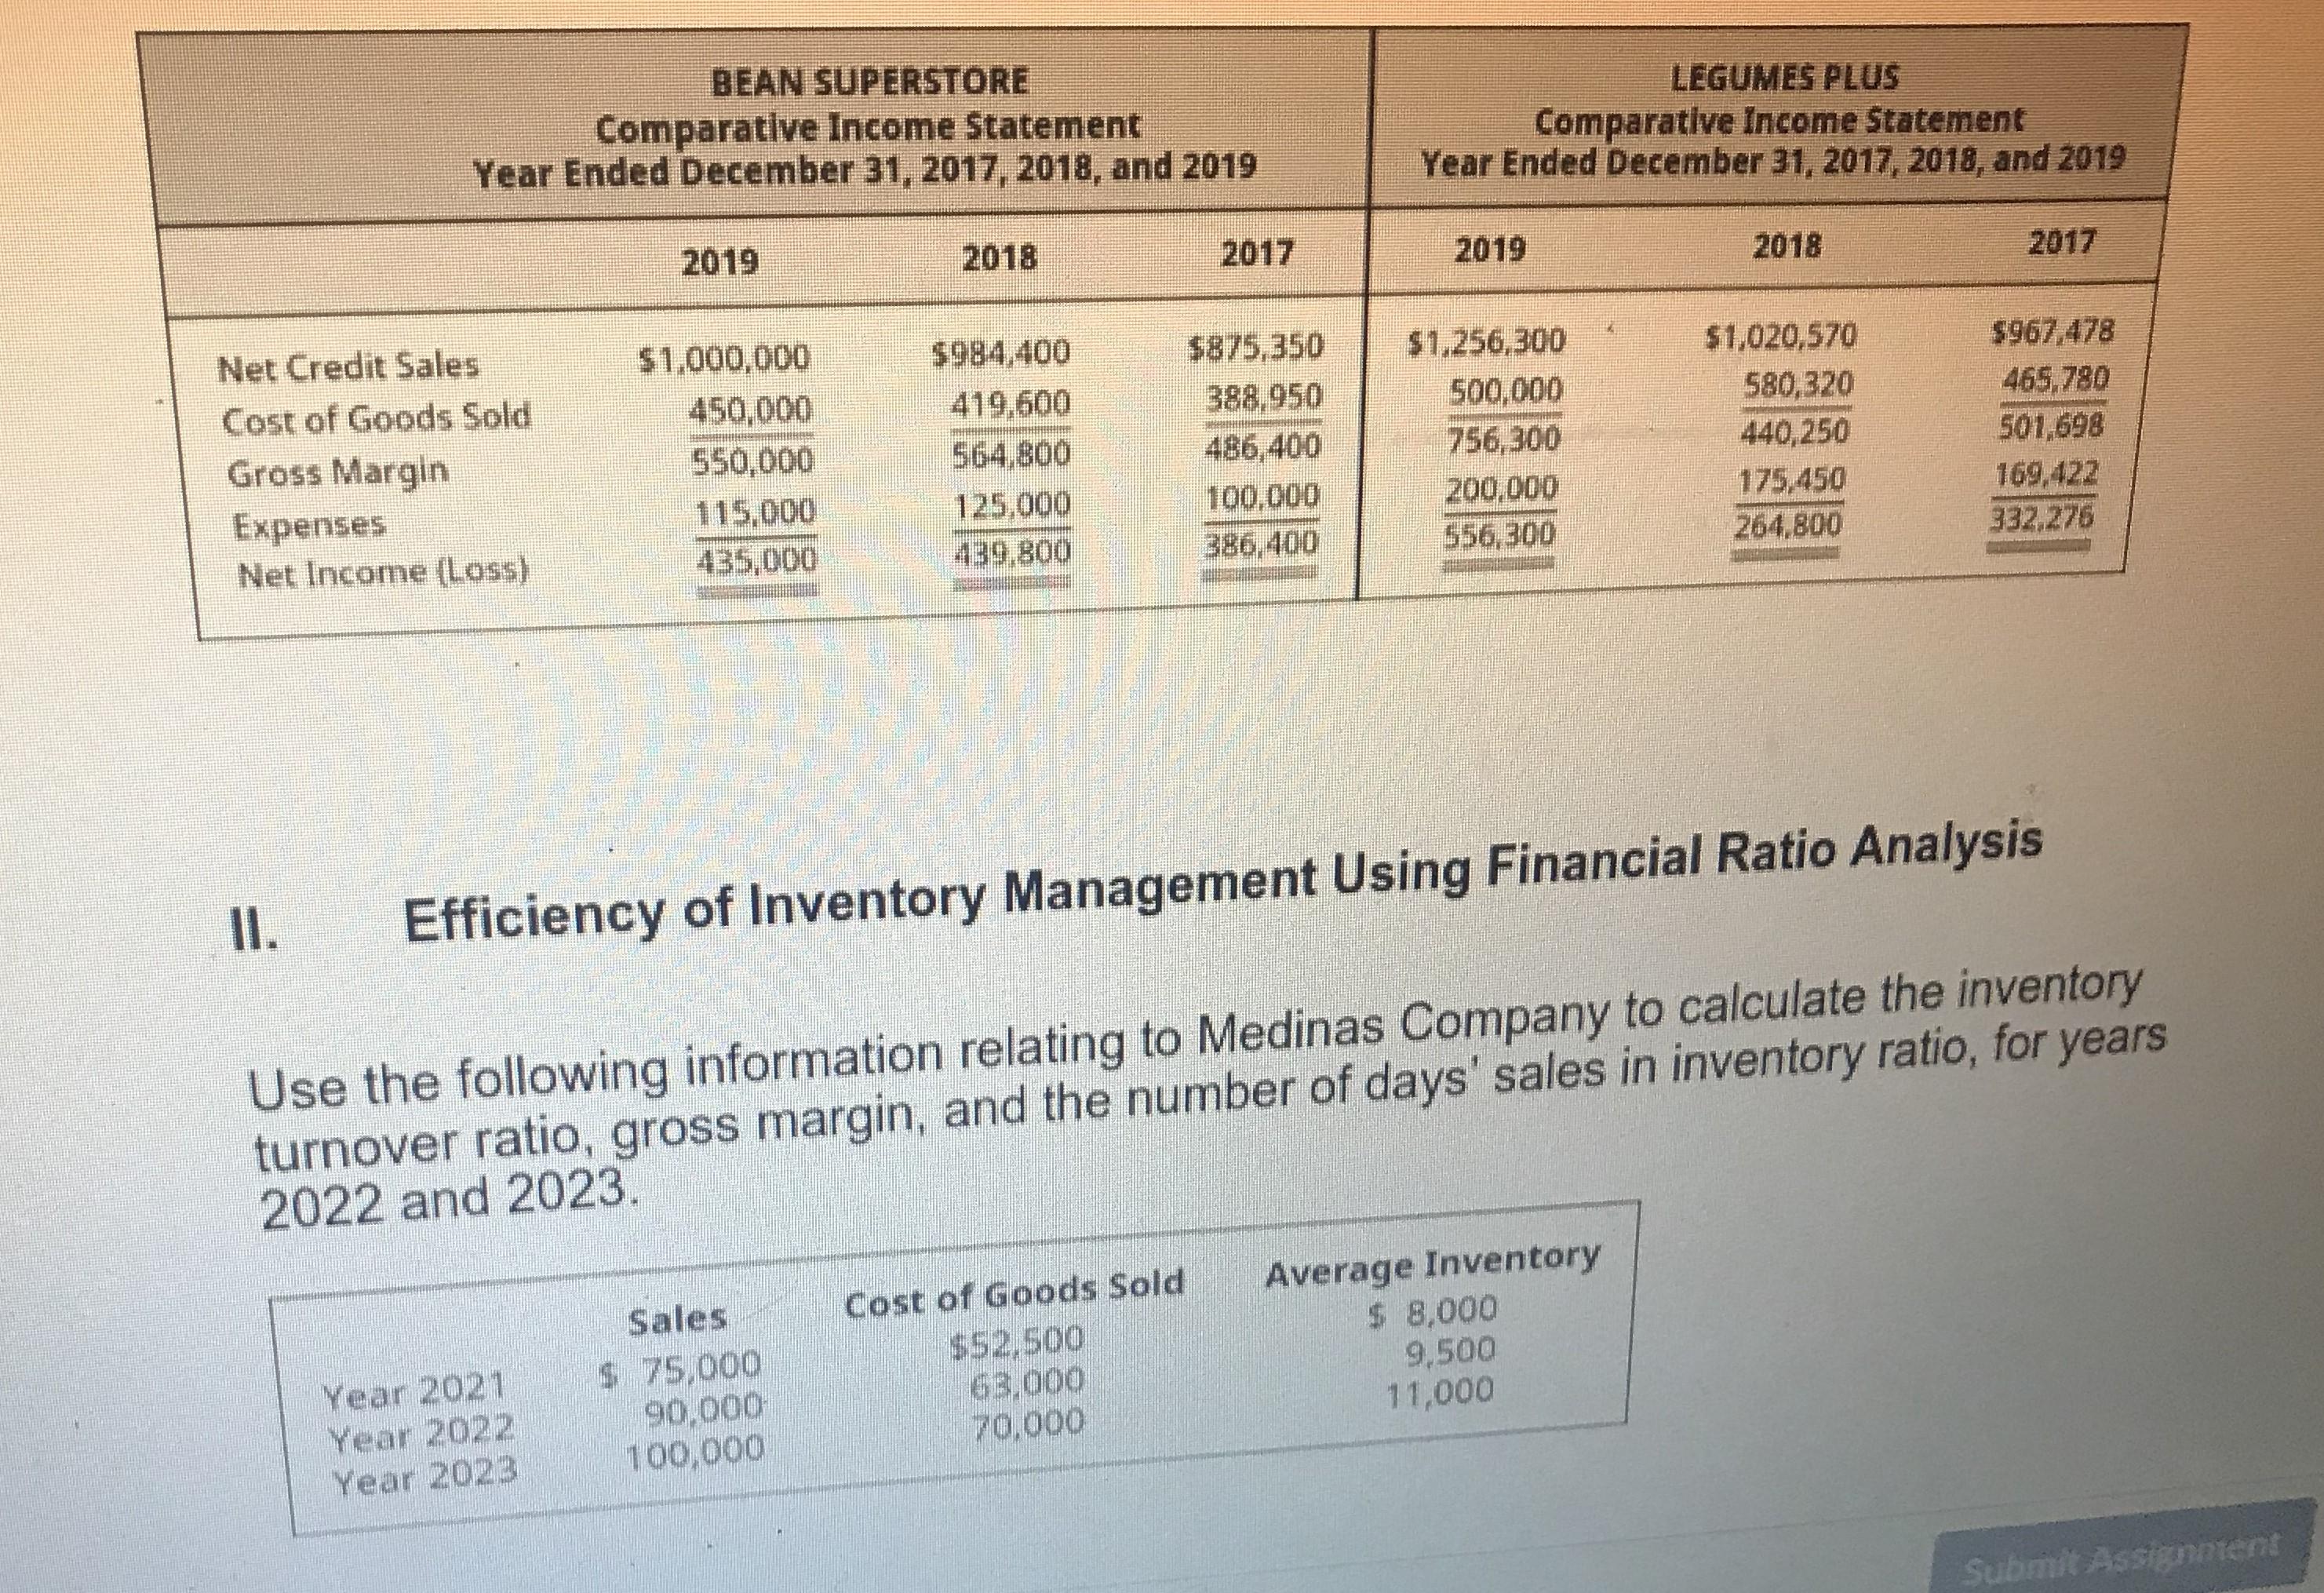
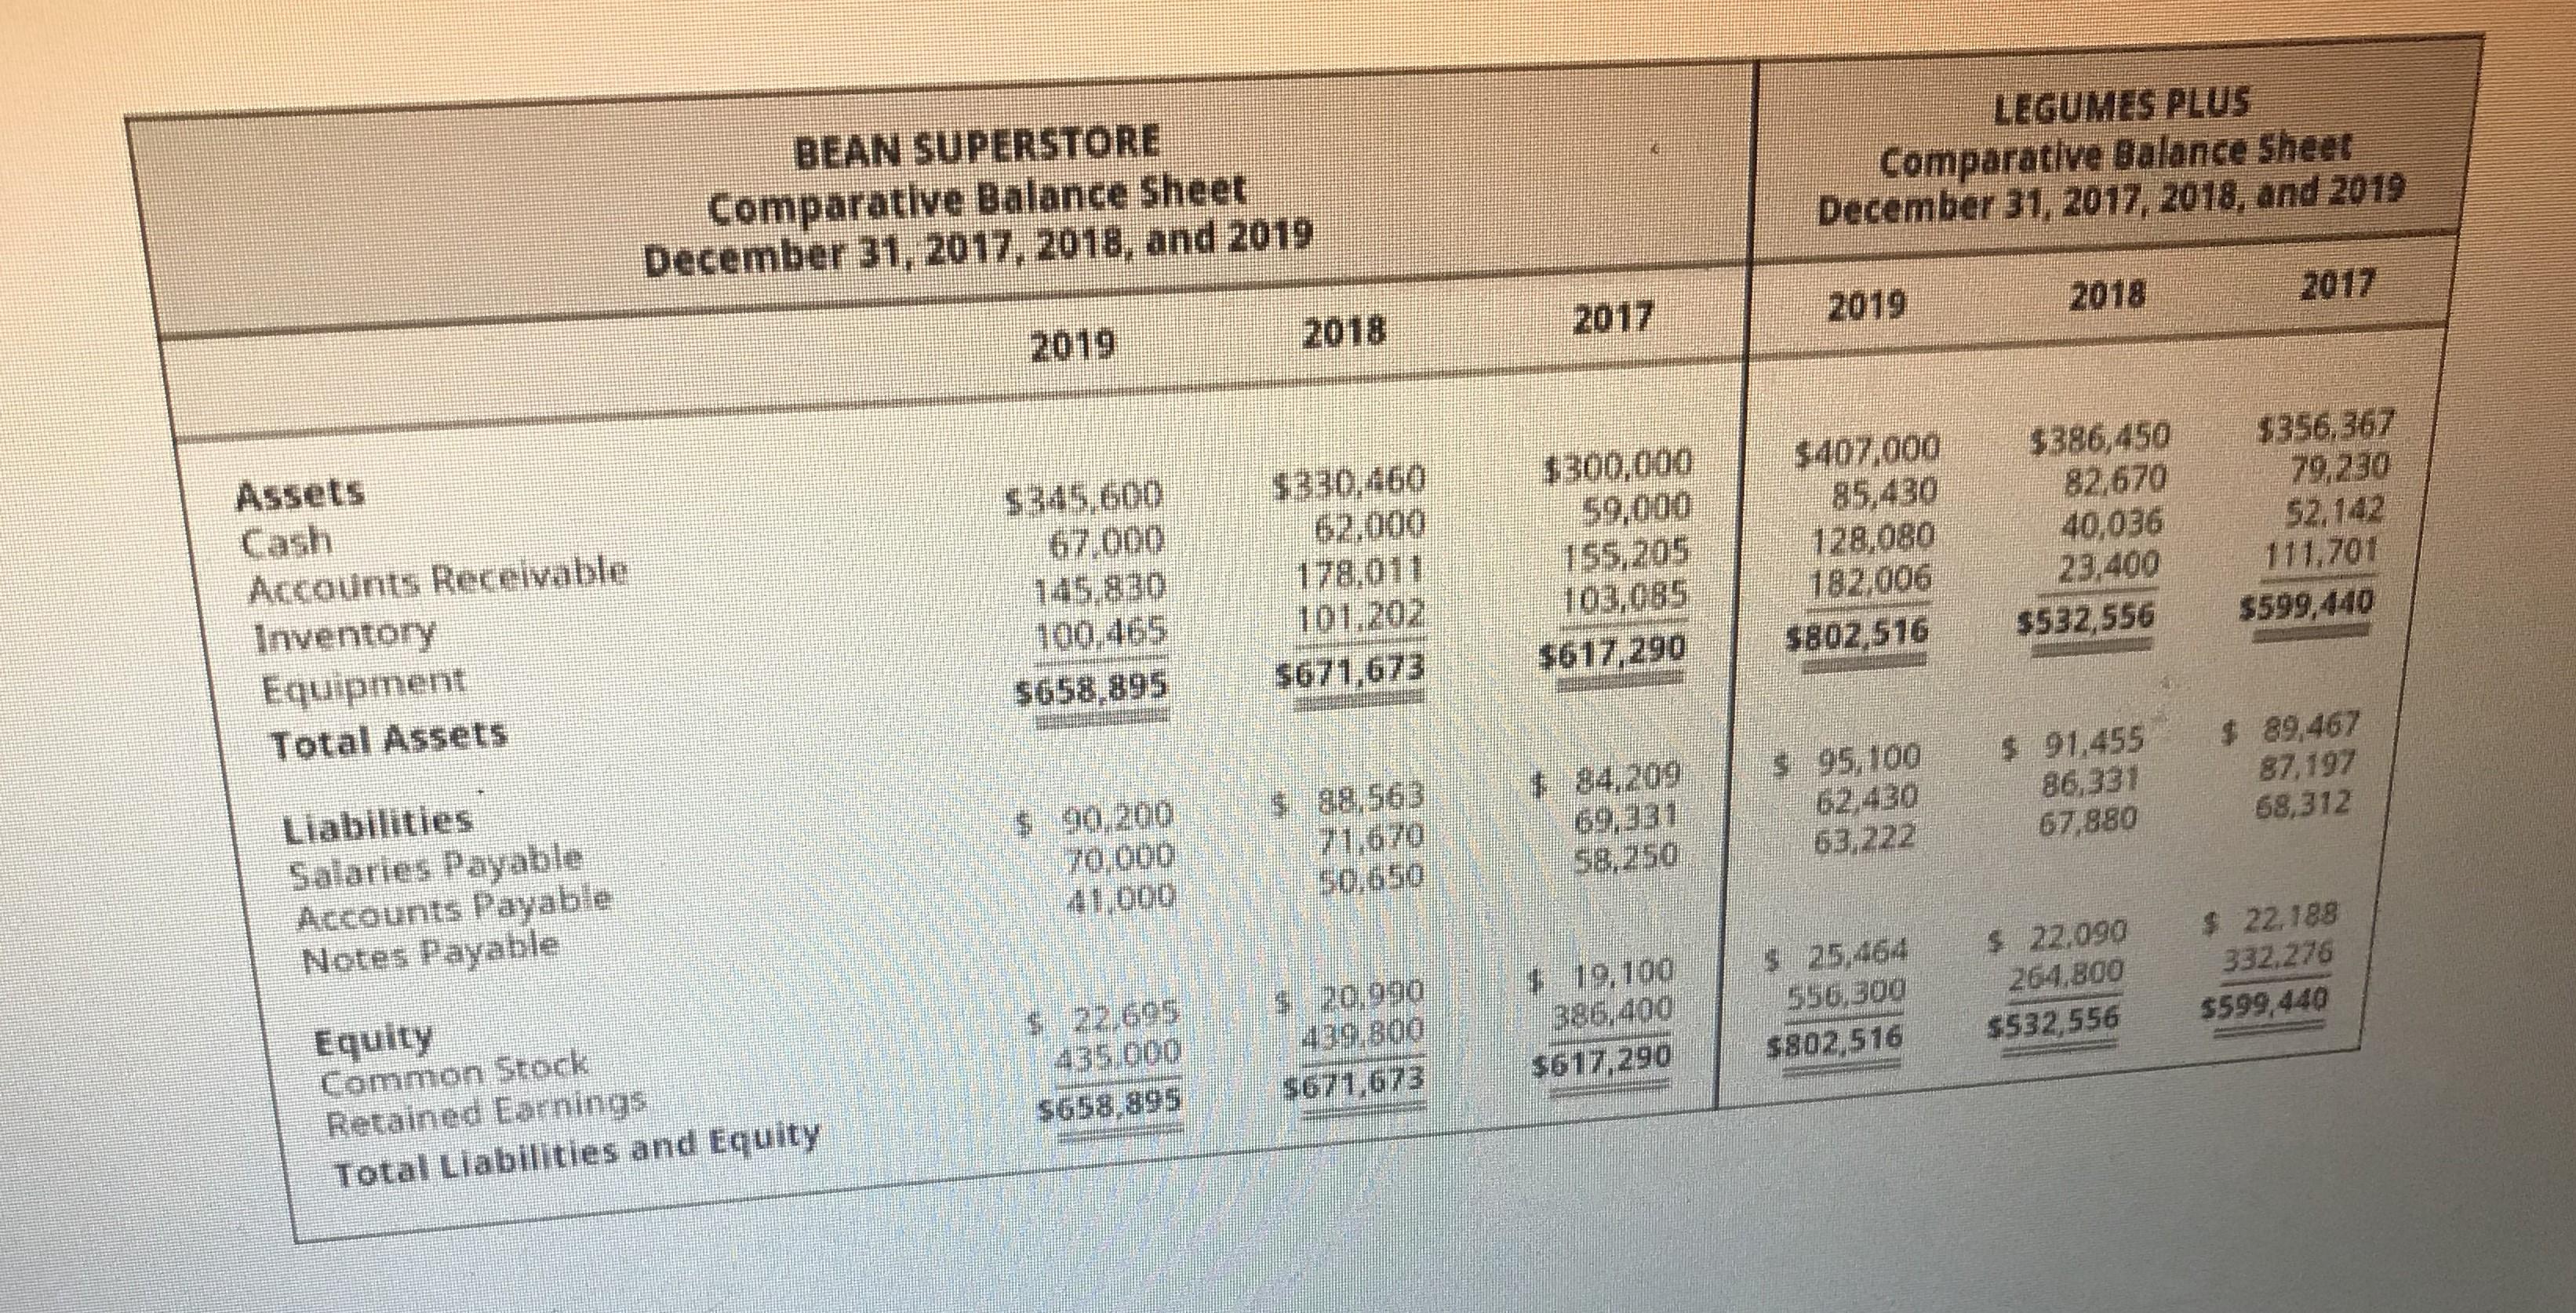
Instructions: This project requires you to apply the concepts and methods learned so far in the course. This is an individual project. You are permitted to discuss this project within your respective group of fellow students. Please note that the project does not have a word count requirement as a brief outline dialogue is all that is necessary. Utilize a Word document that may be attached to your "Assignment Manager link." Each individual will submit their paper to the Professor via the Assignment Manager link. 1. Efficiency of Receivable Management Using Financial Ratio Analysis Review the select information for Bean Superstore and Legumes Plus (industry competitors), and then complete the following. A. Compute the accounts receivable turnover ratios for each company for 2018 and 2019. B. Compute the number of days' sales in receivables ratios for each company for 2018 and 2019. C. Determine which company is the better investment and why. Round answers to two decimal places. BEAN SUPERSTORE Comparative Income Statement Year Ended December 31, 2017, 2018, and 2019 LEGUMES PLUS Comparative Income Statement Year Ended December 31, 2017, 2018, and 2019 2019 2018 2017 2019 2018 2017 Net Credit Sales $1,000,000 $984,400 $875,350 $1,256,300 $1,020,570 $967,478 Cost of Goods Sold 450,000 419,600 388,950 500,000 580,320 465,780 Gross Margin 550,000 564.800 486,400 756,300 440,250 501,698 Expenses 115,000 125,000 100,000 200,000 175,450 169,422 Net Income (Loss) 435,000 439.800 386,400 556,300 264.800 332.276 II. Efficiency of Inventory Management Using Financial Ratio Analysis Use the following information relating to Medinas Company to calculate the inventory turnover ratio, gross margin, and the number of days' sales in inventory ratio, for years 2022 and 2023. Year 2021 Year 2022 Year 2023 Sales $ 75,000 Cost of Goods Sold Average Inventory $52,500 90,000 100,000 63.000 $ 8,000 9,500 70,000 11,000 Submit Assignment Assets BEAN SUPERSTORE Comparative Balance Sheet December 31, 2017, 2018, and 2019 2019 LEGUMES PLUS Comparative Balance Sheet December 31, 2017, 2018, and 2019 2018 2017 2019 2018 2017 Cash $345,600 $330,460 $300,000 $407,000 $386,450 $356.367 Accounts Receivable 67.000 62.000 59.000 85.430 82.670 79.230 Inventory 145.830 178.011 155,205 128,080 40,036 52.142 Equipment 100.465 101.202 103,085 182,006 23,400 111,701 $658,895 $671,673 $617,290 $802,516 $532,556 $599,440 Total Assets Liabilities Salaries Payable Accounts Payable $ 90,200 70,000 41,000 Notes Payable Equity Common Stock Retained Earnings Total Liabilities and Equity $ 88.563 $ 84.209 $ 95,100 71,670 50,650 69,331 58,250 62,430 63,222 $91,455 86.331 67,880 $ 22,695 435.000 $658,895 $ 20.990 439.800 $19,100 386,400 $ 25.464 556,300 5671,673 $617,290 $802,516 $22.090 264,800 $532,556 $ 89,467 87,197 68,312 $ 22.188 332,276 $599,440
Step by Step Solution
There are 3 Steps involved in it
Step: 1
Analyzing Accounts Receivable Efficiency Bean Superstore vs Legumes Plus This document analyzes the ...
Get Instant Access to Expert-Tailored Solutions
See step-by-step solutions with expert insights and AI powered tools for academic success
Step: 2

Step: 3

Ace Your Homework with AI
Get the answers you need in no time with our AI-driven, step-by-step assistance
Get Started


