Instructions: This quiz consists of 24 MC questions. You have 2 hours to complete this quiz and submit your solutions. Work individually! You may use
Instructions: This quiz consists of 24 MC questions. You have 2 hours to complete this quiz and submit your solutions. Work individually! You may use your own formula sheets containing relevant handwritten notes, a standard or scientific calculator, and/or statistical software (e.g., SAS, R). To receive full credit, you must show all your work. Good luck!
Researchers conducted a study to examine the effects of the experimental anti-hypertensive agent GB2995 on diastolic blood pressure (DBP) among 75 patients with moderate to severe hypertension in four study centers. They were interested in comparing 12 weeks of treatment using (1) GB2995 as the sole therapy (SOLE) versus (2) GB2995 in combination with a stable dose of a marketed calcium-channel blocker (COMB) when administered to patients with moderate to severe hypertension. The primary analysis focused on a comparison of the mean change in DBP between the two treatment groups, adjusted for the patient's age (AGE) and severity of hypertension at study entry (BPDIA0). Note that the response to be analyzed is the change (or difference) in the DBP. Also, note that baseline severity is the average DBP obtained on three pre-study visits. Using a 0.05 significance level and the given computer output, you now need to test the claim that the patients in the four study centers have a different mean change in DBP by answering the questions that follow. Note that the change in DBP, baseline severity, and age can be considered continuous here, whereas the study center and treatment group are categorical.
For questions 1-5, examine the computer output of the five different models provided for you in the separate packet labeled SAS Output #1-SAS Output #5. Match the output with the most appropriate analysis. You may select each letter (method) more than once, once or not at all. (1 point each)
1. SAS Output #1 A a. ANCOVA
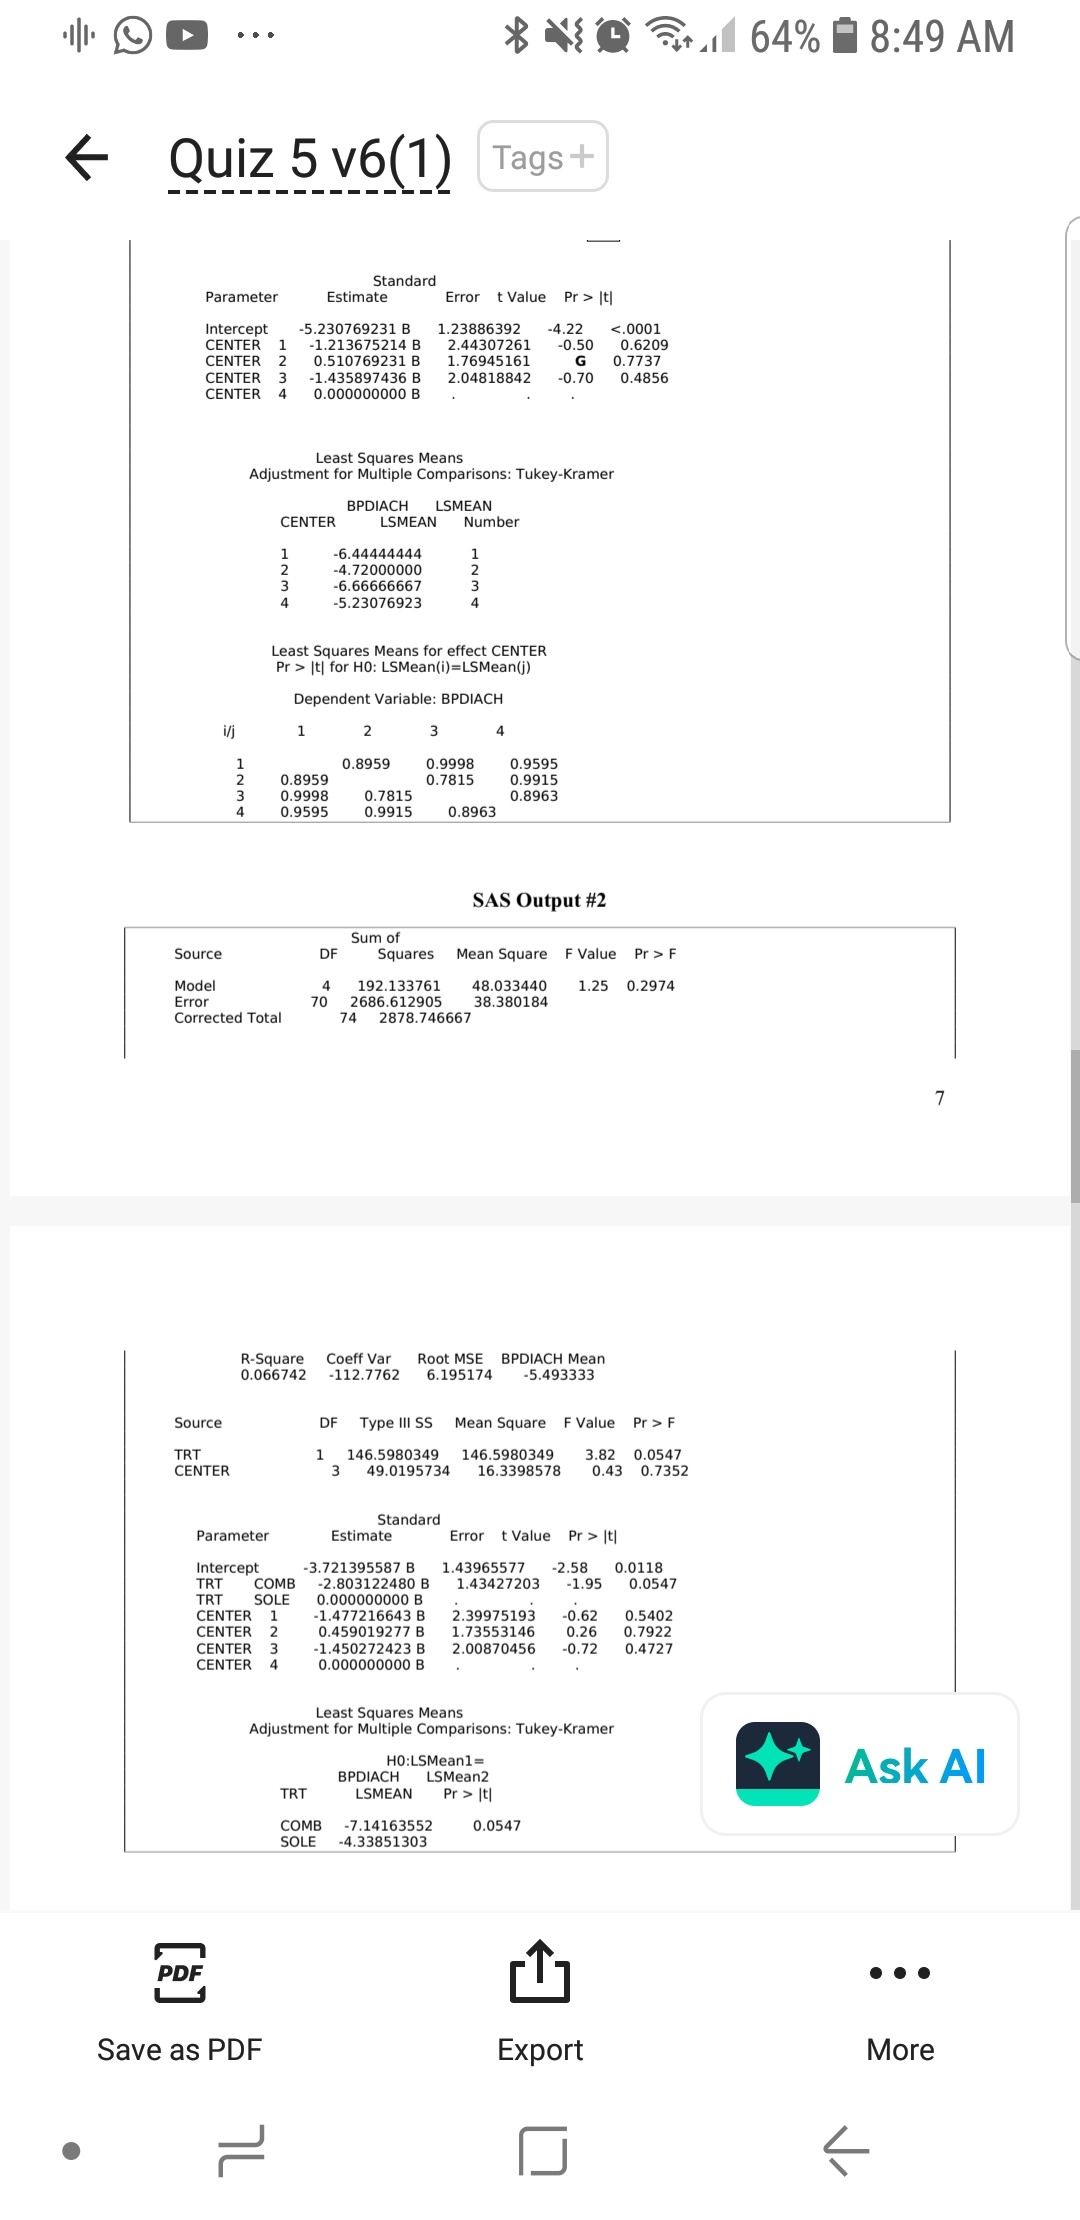
2. SAS Output #2 C b. Multiple linear regression
3. SAS Output #3 B c. One-way ANOVA
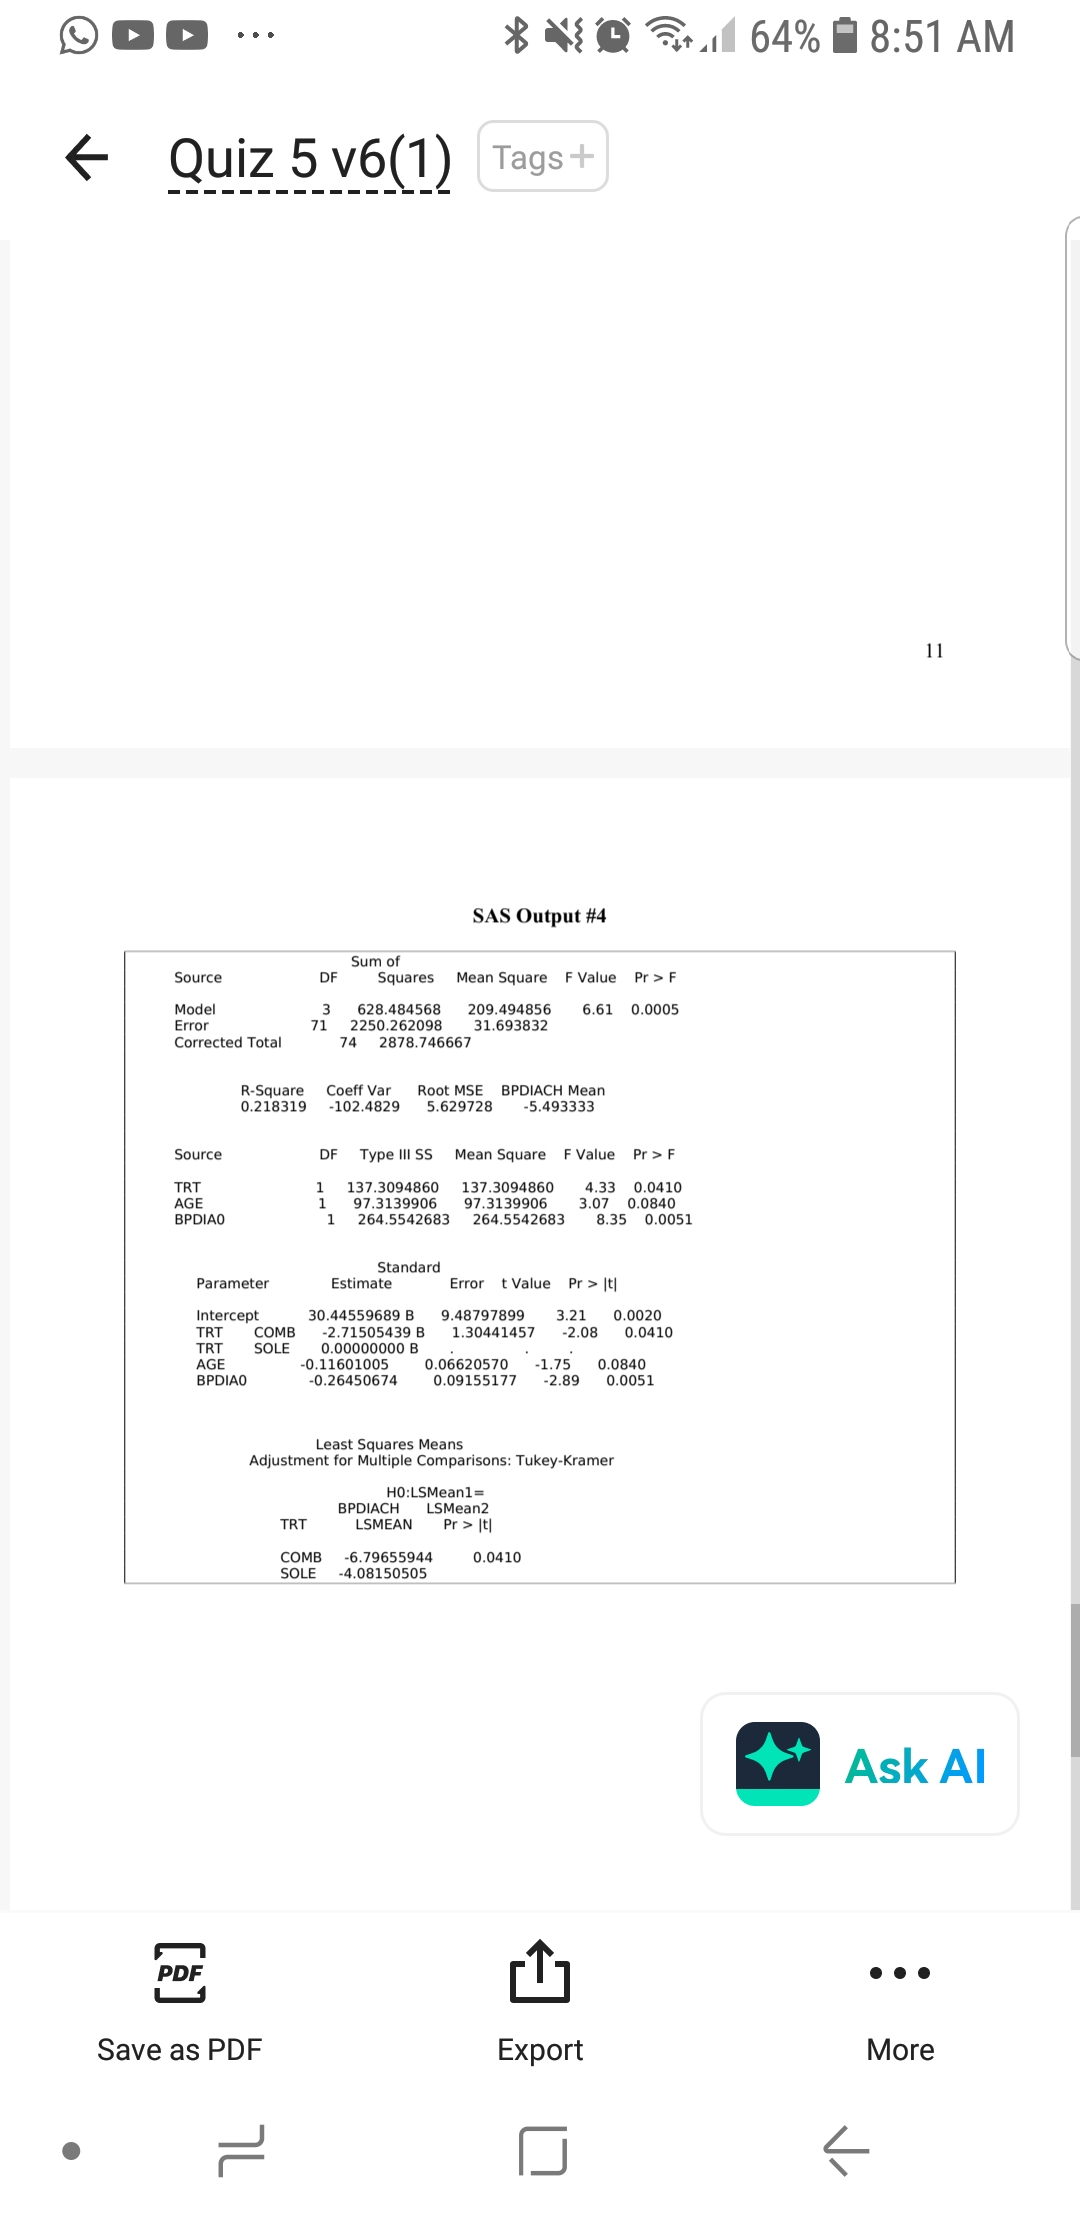
4. SAS Output #4 E d. Two-way ANOVA without an interaction
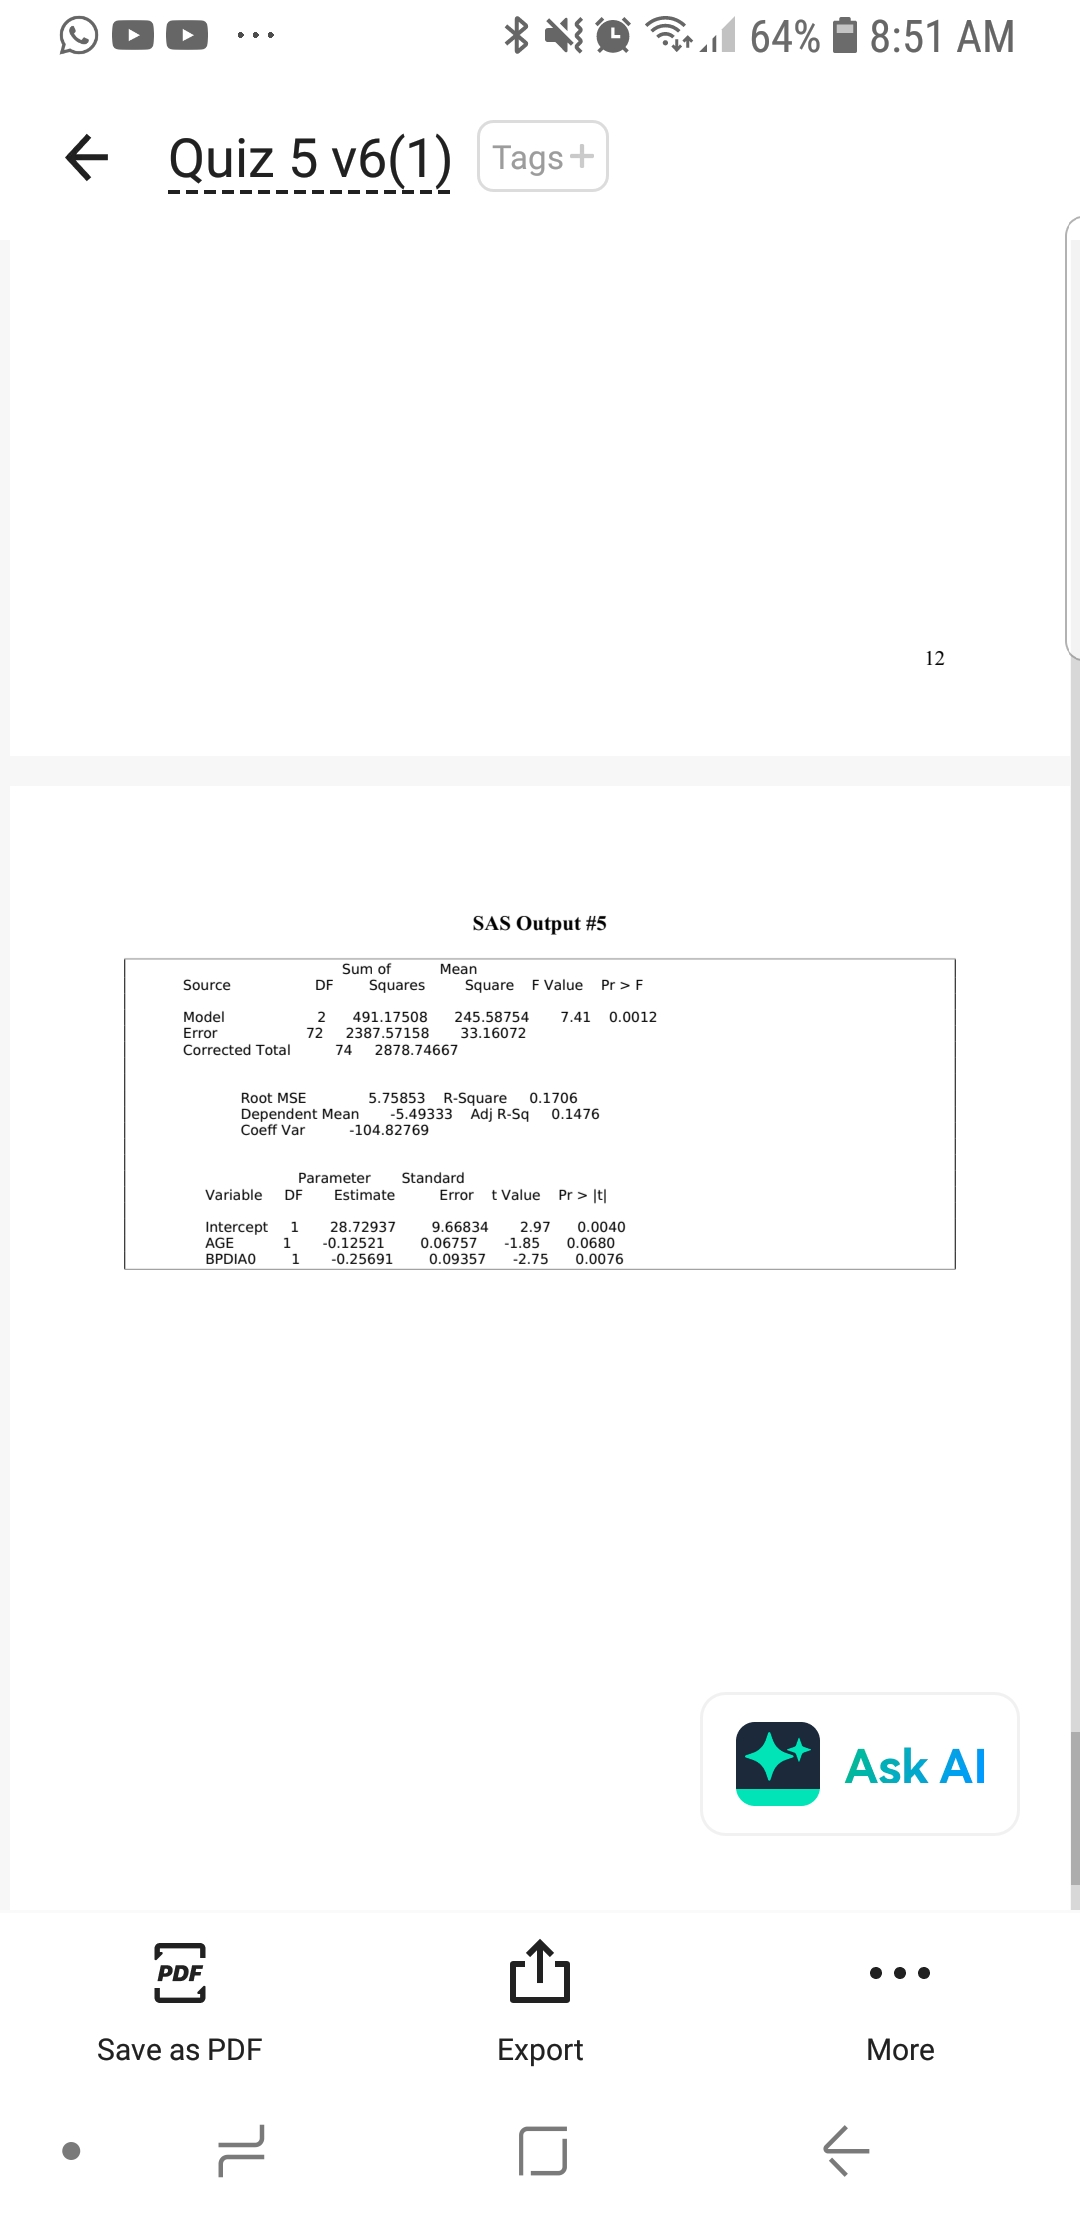
5. SAS Output #5 D e. Two-way ANOVA with an interaction
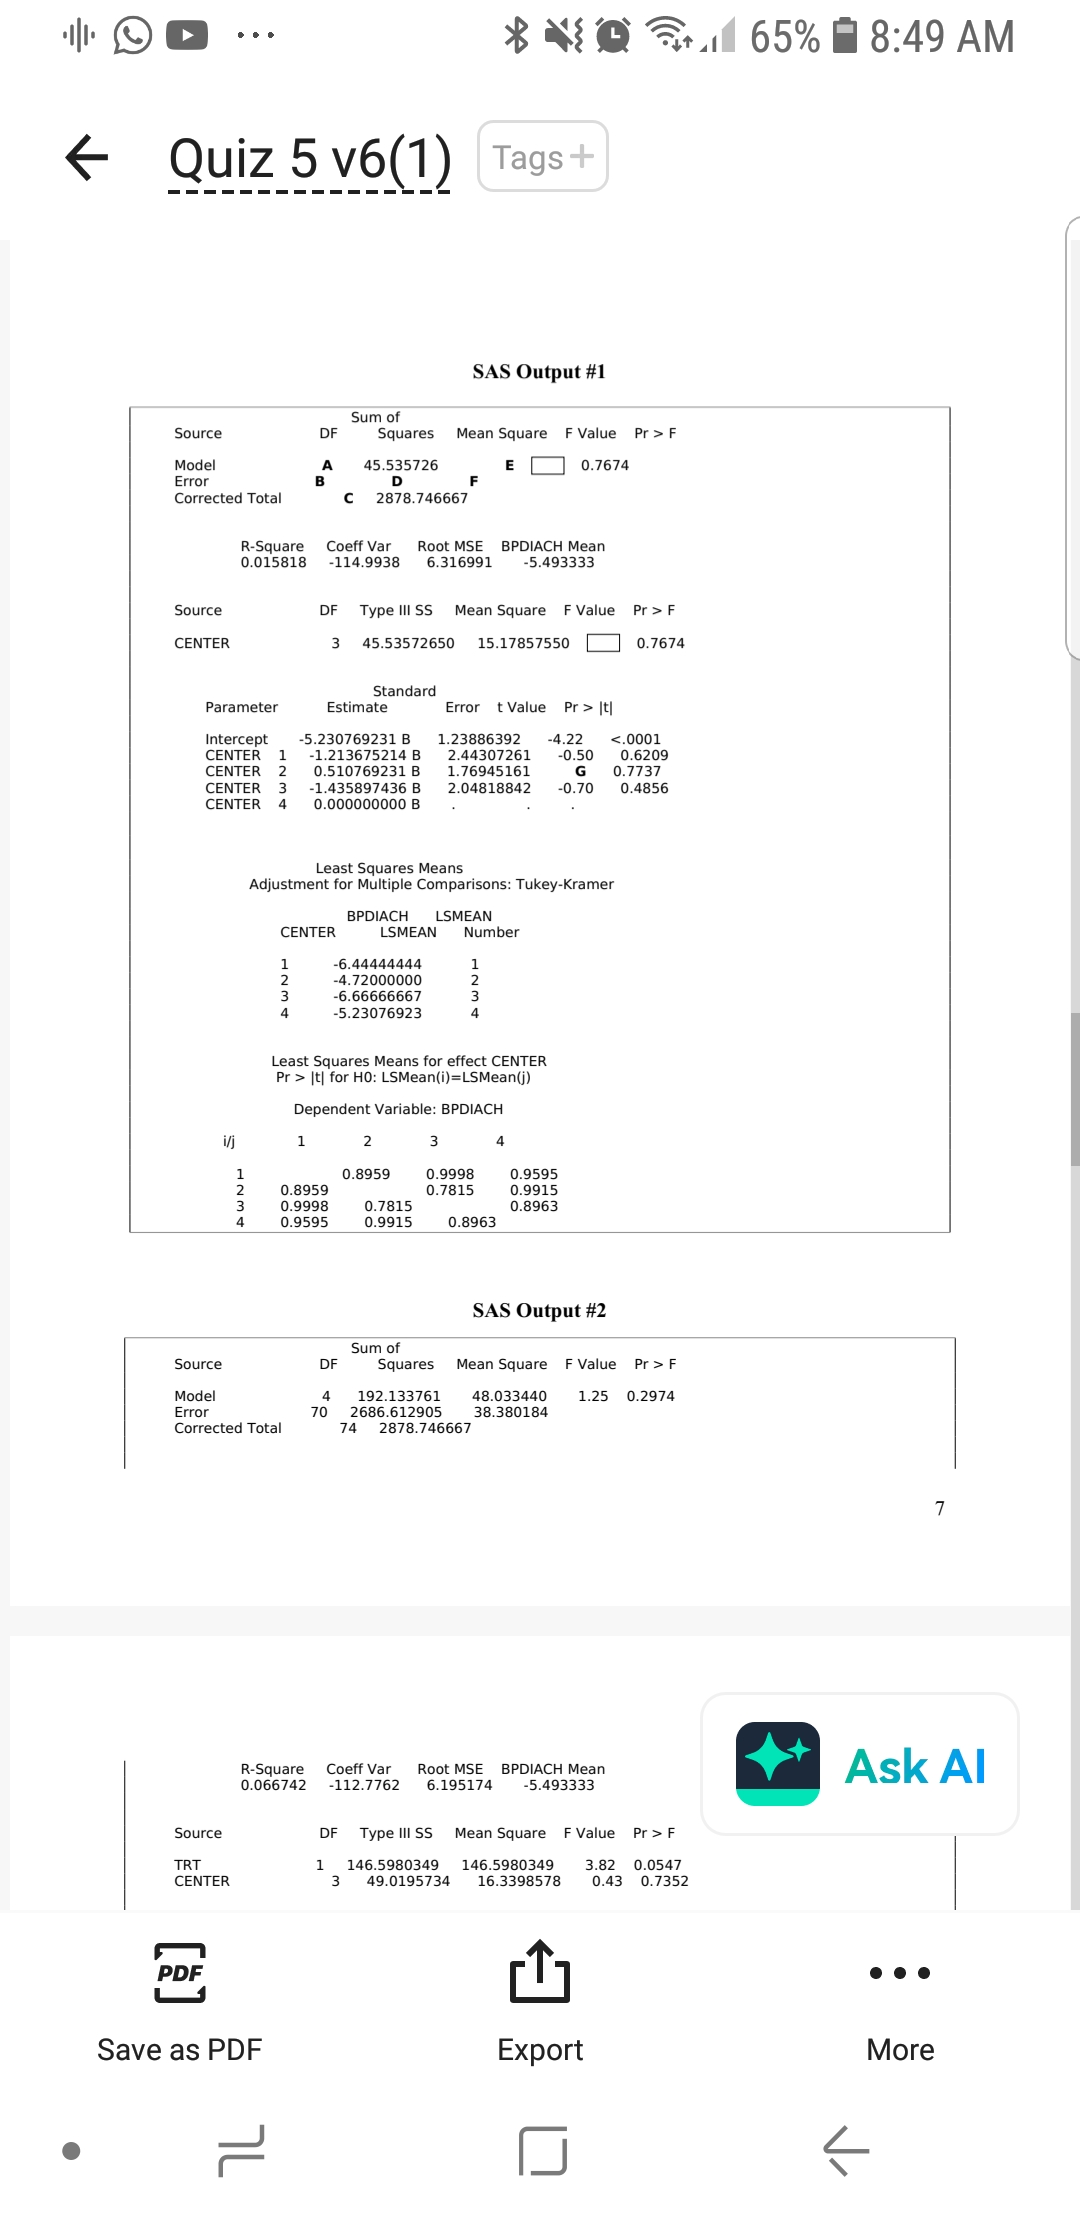
? For questions 6-22, refer to SAS Output #1.
6. What are the omnibus null and alternative hypotheses? (1 point)
a. H0: ?1 = ?2 = ?3 = ?4 =0, H1: at least one ?i ? 0 b. H0: y1 = y2 = y3 = y4, H1: y1 ? y2 ? y3 ? y4 c. H0: ?1 = ?2 = ?3 = ?4, H1: ?1 ? ?2 ? ?3 ? ?4 d. H0: ?1 = ?2 = ?3 = ?4, H1: at least one ?i differs from another ?j e. H0: y1 = y2 = y3 = y4, H1: at least one yi differs from another yj
7. What are the independent and dependent variables? (1 point)
a. Dependent = treatment group, independent = change in DBP b. Dependent = study center, independent = change in DBP c. Dependent = change in DBP, independent = treatment group d. Dependent = change in DBP, independent = study center e. Cannot be determined from the given information.
For questions 8-14 refer to the following: In the first table of SAS Output #1, several important values have been replaced with the letters A-G. You need to find these missing values.
8. Model Degrees of Freedom (labeled A) (0.5 point)
a. 1 b. 2 c. 3 d. 4 e. 5
9. Error Degrees of Freedom (labeled B) (0.5 point)
a. 68 b. 69 c. 70 d. 71 e. 72
10. Total Degrees of Freedom (labeled C) (0.5 point)
a. 72 b. 73 c. 74 d. 75 e. 76
11. Sum of Square Error (labeled D) (0.5 point)
a. 6.32 b. 38.90 c. 55.08 d. 2833.21 e. 2924.29
12. Mean Square Model (labeled E) (0.5 point)
a. 9.11 b. 11.39 c. 15.18 d. 39.90 e. 136.62
13. Mean Square Error (labeled F) (0.5 point)
a. 0.38 b. 39.90 c. 41.06 d. 53.37 e. 8499.63
14. t test statistic (labeled G) (0.5 point)
a. 0.29 b. 0.38 c. 0.51 d. 0.90 e. 1.77
15. What is the value of the test statistic for the omnibus null hypothesis H0? (1 point)
a. 0.29 b. 0.38 c. 0.77 d. 24.72 e. 605.68
16. What is the p-value corresponding to the test statistic in question (15)? (0.5 point)
a. 0.05 b. 0.49 c. 0.62 d. 0.77 e. 0.95
17. Using a 0.05 significance level, what decision and conclusion should you make regarding the omnibus null hypothesis? (1 point)
a. Because p-value 0.05, we fail to reject H0 and conclude that the mean change in DBP does not differ significantly between the 4 study centers. e. Because p-value > 0.05, we reject H0 and conclude that the mean change in DBP does differ significantly between the 4 study centers.
18. Assuming you rejected the omnibus null hypothesis in question 17 (this may or may not be true), what test should you conduct next? (1 point)
a. Multiple comparisons test b. Bonferroni test c. Tukey test d. Any of the above are appropriate e. None of the above are appropriate
19. What is the estimated mean change in DBP for each of the four study centers? (1 point)
? 20. Do any of the 4 study centers differ significantly in their mean change in DBP? If so, which one(s)? (1 point)
a. Yes, ?1 ? ?3 b. Yes, ?1 ? ?4 c. Yes, ?2 ? ?4 d. Both a and c e. No, the 4 study centers have the same mean change in DBP.
21. What types of variation, if any, are being analyzed in this problem? (1 point)
a. We are comparing the mean change in DBP for 4 groups, which has nothing to do with variation. b. Variation in changes in DBP between study centers c. Variation in changes in DBP within study centers d. Both b and c e. None of the above
22. Is there a reference cell in this problem? If so, what is it? (1 point)
a. Yes, the reference cell is study center 1. b. Yes, the reference cell is study center 2. c. Yes, the reference cell is study center 3. d. Yes, the reference cell is study center 4. e. Yes, there is a reference cell but the group cannot be determined with the given output. f. No, there is no reference cell.
23. Recall that the researchers' primary analysis focused on a comparison of the mean change in DBP between the two treatment groups, adjusted for the patient's age and severity of hypertension at study entry. Using the most appropriate model, select which of the following statements is true. (1 point)
a. Mean change in DBP differs significantly based on treatment, age, and baseline severity. b. Mean change in DBP differs significantly based on the baseline severity but not on age or treatment group. c. Mean change in DBP differs significantly based on the treatment group but not age or baseline severity. d. Mean change in DBP differs significantly between the treatment groups, after adjusting for age and baseline severity. e. Mean change in DBP does not differ significantly between the treatment groups, after adjusting for age and baseline severity.
? 24. The interaction plot below was generated from the model in SAS Output #3. What can you say about the following figure? (1 point)
a. There is a same direction interaction between treatment group and study center. b. There is a reverse interaction between treatment group and study center. c. There is no significant interaction between treatment group and study center. d. As study center increases, the change in DBP increases at the same rate for both treatment groups. e. Both c and d
oo - B N{ @ =0 65% H 8:49 AM Quiz5v6(1) Taos 23. Recall that the researchers' primary analysis focused on a comparison of the mean change in DBP between the two treatment groups, adjusted for the patient's age and severity of hypertension at study entry. Using the most appropriate model, select which of the following statements is true. (1 point) a. b. Mean change in DBP differs significantly based on treatment, age, and baseline severity. Mean change in DBP differs significantly based on the baseline severity but not on age or treatment group. Mean change in DBP differs significantly based on the treatment group but not age or baseline severity. Mean change in DBP differs significantly between the treatment groups, after adjusting for age and baseline severity. Mean change in DBP does not differ significantly between the treatment groups, after adjusting for age and baseline severity. 24, The interaction plot below was generated from the model in SAS Output #3, What can you say about the following figure? (1 point) e ow 0 * SOLE = COMB Mean Change in DBP L & & 4 & b 1 2 3 a4 Study Center There is a same direction interaction between treatment group and study center. There is a reverse interaction between treatment group and study center. There is no significant interaction between treatment group and study center. As study center increases, the change in DBP increases at the same rate for both treatment groups. Both and d Save as PDF Export More = O .I D ... $ 65% 8:49 AM - Quiz 5 v6(1) Tags + SAS Output #1 Sum of Source DF Squares Mean Square F Value Pr > F Mode A 45.535726 E 0.7674 Error B D Corrected Total C 2878.746667 R-Square Coeff Var Root MSE BPDIACH Mean 0.015818 -114.9938 6.316991 -5.493333 Source DF Type Ill SS Mean Square F Value Pr > F CENTER 3 45.53572650 15.17857550 0.7674 Standard Parameter Estimate Error t Value Pr > It| Intercept 5.230769231 B 1.23886392 4.22 <.0001 center b g least squares means adjustment for multiple comparisons: tukey-kramer bpdiach lsmean number awnh effect pr> It) for HO: LSMean(i)=LSMean(j) Dependent Variable: BPDIACH i/j 1 2 3 0.8959 0.9998 0.9595 0.8959 0.7815 0.9915 AWNH 0.9998 0.7815 0.8963 0.9595 0.9915 0.8963 SAS Output #2 Sum of Source DF Squares Mean Square F Value Pr > F Mode 4 192.133761 48.033440 1.25 0.2974 Error 70 2686.612905 38.380184 Corrected Total 74 2878.746667 7 R-Square Coeff Var Root MSE BPDIACH Mean 0.066742 6.195174 Ask Al -112.7762 -5.493333 Source DF Type III SS Mean Square F Value Pr > F TRT 1 146.5980349 146.5980349 3.82 0.0547 CENTER 3 49.0195734 16.3398578 0.43 0.7352 PDF . . Save as PDF Export More J.I D ... $ 64% 8:49 AM Quiz 5 v6(1) Tags + Standard Parameter Estimate Error t Value Pr > It| Intercept 5.230769231 B 1.23886392 4.22 <.0001 center b g least squares means adjustment for multiple comparisons: tukey-kramer bpdiach lsmean number nh awnh effect pr> [t) for HO: LSMean(i)=LSMean(j) Dependent Variable: BPDIACH V/j 1 2 0.8959 0.9998 0.9595 0.8959 0.7815 0.9915 AWNH 0.9998 0.7815 0.8963 0.9595 0.9915 0.8963 SAS Output #2 Sum of Source DF Squares Mean Square F Value Pr > F Mode 4 192.133761 48.033440 1.25 0.2974 Error 70 2686.612905 38.380184 Corrected Total 74 2878.746667 7 R-Square Coeff Var Root MSE BPDIACH Mean 0.066742 -112.7762 6.195174 -5.493333 Source DF Type Ill SS Mean Square F Value Pr > F TRT 146.5980349 146.5980349 3.82 0.0547 CENTER 49.0195734 16.3398578 0.43 Standard Parameter Estimate Error t Value Pr > (t/ Intercept -3.721395587 B 1.43965577 2.58 0.0118 TRT COMB -2.803122480 B 1.43427203 -1.95 0.0547 TRT SOLE 0.000000000 B CENTER 1 -1.477216643 B 2.39975193 -0.62 0.5402 CENTER 0.459019277 B 1.73553146 0.26 0.7922 CENTER 1.450272423 B 2.00870456 0.72 0.4727 CENTER 0.000000000 B Least Squares Means Adjustment for Multiple Comparisons: Tukey-Kramer HO:LSMean1= BPDIACH LSMean2 Ask Al TRT LSMEAN Pr > It COMB -7.14163552 0.0547 SOLE -4.33851303 PDF . . . Save as PDF Export More J <.i d ... am quiz v6 tags standard parameter estimate error t value pr> It| Intercept 5.230769231 B 1.23886392 4.22 <.0001 center b g least squares means adjustment for multiple comparisons: tukey-kramer bpdiach lsmean number nh awnh effect pr> [t) for HO: LSMean(i)=LSMean(j) Dependent Variable: BPDIACH V/j 1 2 0.8959 0.9998 0.9595 0.8959 0.7815 0.9915 AWNH 0.9998 0.7815 0.8963 0.9595 0.9915 0.8963 SAS Output #2 Sum of Source DF Squares Mean Square F Value Pr > F Mode 4 192.133761 48.033440 1.25 0.2974 Error 70 2686.612905 38.380184 Corrected Total 74 2878.746667 7 R-Square Coeff Var Root MSE BPDIACH Mean 0.066742 -112.7762 6.195174 -5.493333 Source DF Type Ill SS Mean Square F Value Pr > F TRT 146.5980349 146.5980349 3.82 0.0547 CENTER 49.0195734 16.3398578 0.43 Standard Parameter Estimate Error t Value Pr > (t/ Intercept -3.721395587 B 1.43965577 2.58 0.0118 TRT COMB -2.803122480 B 1.43427203 -1.95 0.0547 TRT SOLE 0.000000000 B CENTER 1 -1.477216643 B 2.39975193 -0.62 0.5402 CENTER 0.459019277 B 1.73553146 0.26 0.7922 CENTER 1.450272423 B 2.00870456 0.72 0.4727 CENTER 0.000000000 B Least Squares Means Adjustment for Multiple Comparisons: Tukey-Kramer HO:LSMean1= BPDIACH LSMean2 Ask Al TRT LSMEAN Pr > It COMB -7.14163552 0.0547 SOLE -4.33851303 PDF . . . Save as PDF Export More J It COMB -7.14163552 0.0547 SOLE -4.33851303 SAS Output #2 (continued) Least Squares Means Adjustment for Multiple Comparisons: Tukey-Kramer BPDIACH LSMEAN CENTER LSMEAN Number -6.60017347 NH -4.66393755 AWNH -6.57322925 -5.12295683 Least Squares Means for effect CENTER Pr > [t) for HO: LSMean(i)=LSMean(j) Dependent Variable: BPDIACH i/j 1 2 0.8527 1.0000 0.9268 Ask Al 0.8527 0.7815 0.9935 AWNH 1.0000 0.7815 0.8880 0.9268 0.9935 0.8880 PDF . . . Save as PDF Export More J F Model 201.085495 28.726499 0.72 0.6564 Error 2677.661172 39.965092 Corrected Total 74 2878.746667 R-Square Coeff Var Root MSE BPDIACH Mean 0.069852 -115.0812 6.321795 -5.493333 Source DF Type Ill SS Mean Square F Value Pr > F TRT 102.3009023 102.3009023 2.56 0.1143 CENTER 46.2763196 15.4254399 0.39 0.7634 TRT*CENTER 8.9517331 2.9839110 0.07 0.9734 Standard Parameter Estimate Error t Value Pr > It/ Intercept 3.583333333 B 1.82494502 1.96 0.0537 TRT COMB -3.059523810 B 2.48698086 -1.23 0.2229 TRT SOLE 0.000000000 B CENTER 1 2.416666667 B 3.36503236 -0.72 0.4751 CENTER 0.333333333 B 2.58086200 0.13 0.8976 CENTER -1.273809524 B 3.00661325 -0.42 0.6732 CENTER 0.000000000 B TRT*CENTER COMB 1 2.059523810 B 4.91623486 0.42 0.6766 TRT*CENTER COMB 2 0.232600733 B 3.54820180 0.07 0.9479 TRT*CENTER COMB 3 -0.333333333 B 4.10974563 0.08 0.9356 TRT*CENTER COMB 4 0.000000000 B TRT*CENTER SOLE 1 0.000000000 B TRT*CENTER SOLE 2 0.000000000 B TRT*CENTER SOLE 3 0.000000000 B TRT*CENTER SOLE 4 0.000000000 B 10 SAS Output #3 (continued) Least Squares Means Adjustment for Multiple Comparisons: Tukey-Kramer BPDIACH LSMEAN TRT CENTER LSMEAN Number Ask Al COMB -7.00000000 COMB 6.07692308 WNH COMB -8.25000000 COMB 4 -6.64285714 OUDWNH SOLE 6.0000000 SOLE 3.25000000 CAIT PDF . . . Save as PDF Export More It| Intercept 3.583333333 B 1.82494502 -1.96 0.0537 TRT COMB -3.059523810 B 2.48698086 -1.23 0.2229 TRT SOLE 0.000000000 B CENTER 1 -2.416666667 B 3.36503236 0.72 0.4751 CENTER 0.333333333 B 2.58086200 0.13 0.8976 CENTER -1.273809524 B 3.00661325 -0.42 0.6732 CENTER 0.000000000 B TRT*CENTER COMB 1 2.059523810 B 4.91623486 0.42 0.6766 TRT*CENTER COMB 2 0.232600733 B 3.54820180 0.07 0.9479 TRT*CENTER COMB 3 -0.333333333 B 4.10974563 0.08 0.9356 TRT*CENTER COMB 4 0.000000000 B TRT*CENTER SOLE 1 0.000000000 B TRT*CENTER SOLE 2 0.000000000 B TRT*CENTER SOLE 3 0.000000000 B TRT*CENTER SOLE 4 0.000000000 B 10 SAS Output #3 (continued) Least Squares Means Adjustment for Multiple Comparisons: Tukey-Kramer BPDIACH LSMEAN TRT CENTER LSMEAN Number COMB -7.00000000 COMB AWNN -6.07692308 COMB -8.25000000 COMB -6.64285714 SOLE 6.00000000 SOLE -3.25000000 SOLE -4.85714286 SOLE -3.58333333 Least Squares Means for effect TRT*CENTER Pr > [t) for HO: LSMean(i)=LSMean(j) Dependent Variable: BPDIACH 1 2 3 8 1.0000 1.0000 1.0000 1.0000 0.9685 0.9994 0.98 1.000 0.9943 1.0000 1.0000 0.9508 0.9999 0.97 0.9984 Ask Al 1.0000 0.9943 0.9991 0.6662 0.9669 0.73 1.0000 1.0000 0.9991 1.0000 0.8699 0.9986 0.91 DO VOUTAWNY 1.0000 1.0000 0.9984 1.0000 0.9916 1.0000 0.95 0.9685 0.9508 0.6662 0.8699 0.9916 0.9994 1.000 0.9994 0.9999 0.9669 0.9986 1.0000 0.9994 0.9999 0.9813 0.9750 0.7383 0.9199 0.9962 1.0000 0.9999 PDF . . . Save as PDF Export More JODD ... $ 64% 8:51 AM - Quiz 5 v6(1) Tags + 11 SAS Output #4 Sum of Source DF Squares Mean Square F Value Pr > F Mode 3 628.484568 209.494856 6.61 0.0005 Error 71 2250.262098 31.693832 Corrected Total 74 2878.746667 R-Square Coeff Var Root MSE BPDIACH Mean 0.218319 -102.4829 5.629728 -5.493333 Source DF Type III SS Mean Square F Value Pr > F TRT 137.3094860 137.3094860 4.33 0.0410 AGE 97.3139906 97.3139906 3.07 0.0840 BPDIAO 264.5542683 264.5542683 8.35 0.0051 Standard Parameter Estimate Error t Value Pr > It| Intercept 30.44559689 B 9.48797899 3.21 0.0020 TRT COMB -2.71505439 B 1.30441457 -2.08 0.0410 TRT SOLE 0.00000000 B AGE 0.11601005 0.06620570 -1.75 0.0840 BPDIAO 0.26450674 0.09155177 -2.89 0.0051 Least Squares Means Adjustment for Multiple Comparisons: Tukey-Kramer HO:LSMean1= BPDIACH LSMean2 TRT LSMEAN Pr > It COMB -6.79655944 0.0410 SOLE 4.08150505 Ask Al PDF . . . Save as PDF Export More J F Model 491.17508 245.58754 7.41 0.0012 Error 12 2387.5715 33.16072 Corrected Total 2878.74667 Root MSE 5.75853 R-Square 0.1706 Dependent Mean -5.49333 Adj R-Sq 0.1476 Coeff Var -104.82769 Parameter Standard Variable DF Estimate Error t Value Pr > It| Intercept 1 28.72937 9.66834 2.97 0.0040 AGE 1 0.12521 .06757 1.85 0.0680 BPDIAO -0.25691 0.09357 -2.75 0.0076 Ask Al PDF . . . Save as PDF Export More J <
Step by Step Solution
There are 3 Steps involved in it
Step: 1
Get Instant Access to Expert-Tailored Solutions
See step-by-step solutions with expert insights and AI powered tools for academic success
Step: 2
Step: 3
Ace Your Homework with AI
Get the answers you need in no time with our AI-driven, step-by-step assistance