Instructions wwwwww h // // // // h Statistics may be dened as 'a body of methods for making wise decisions in the face of
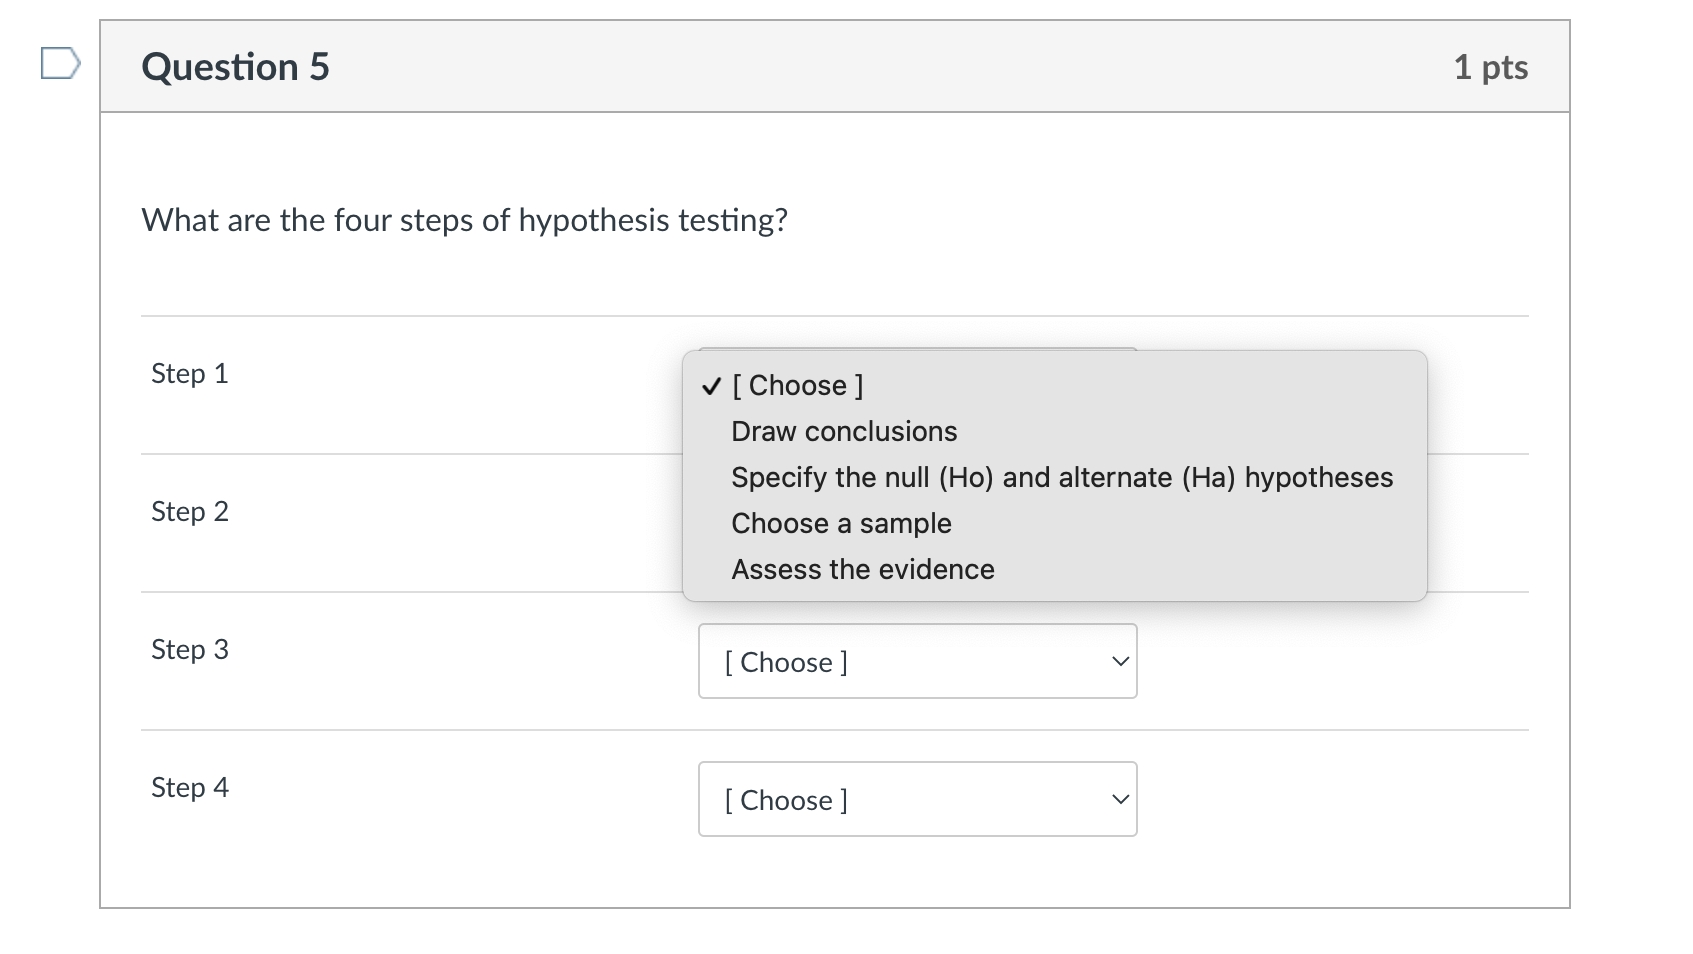
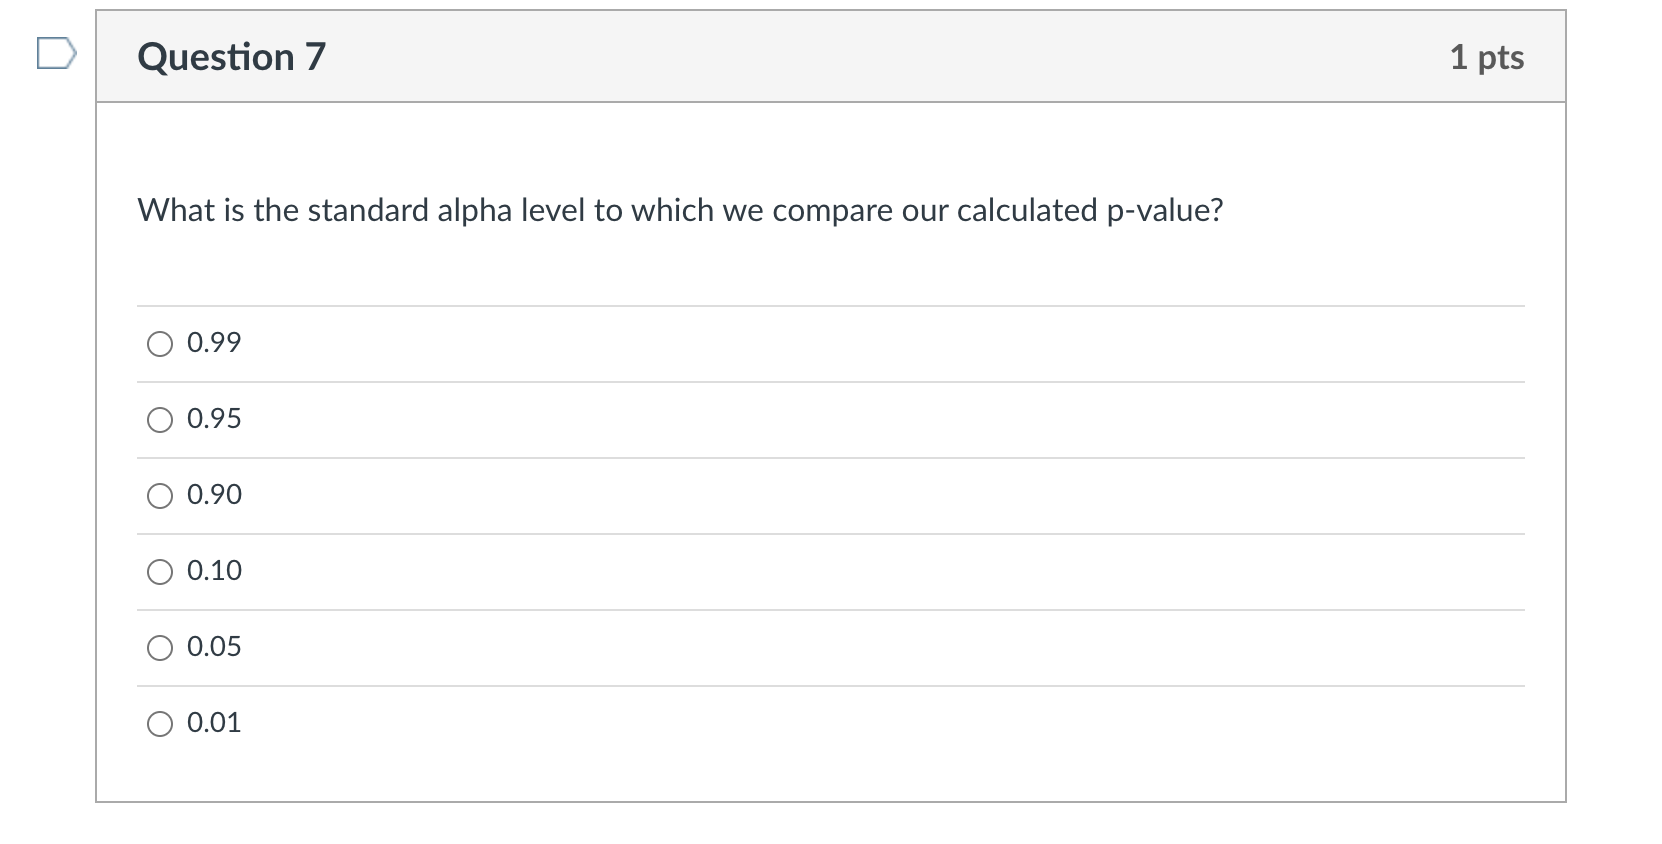
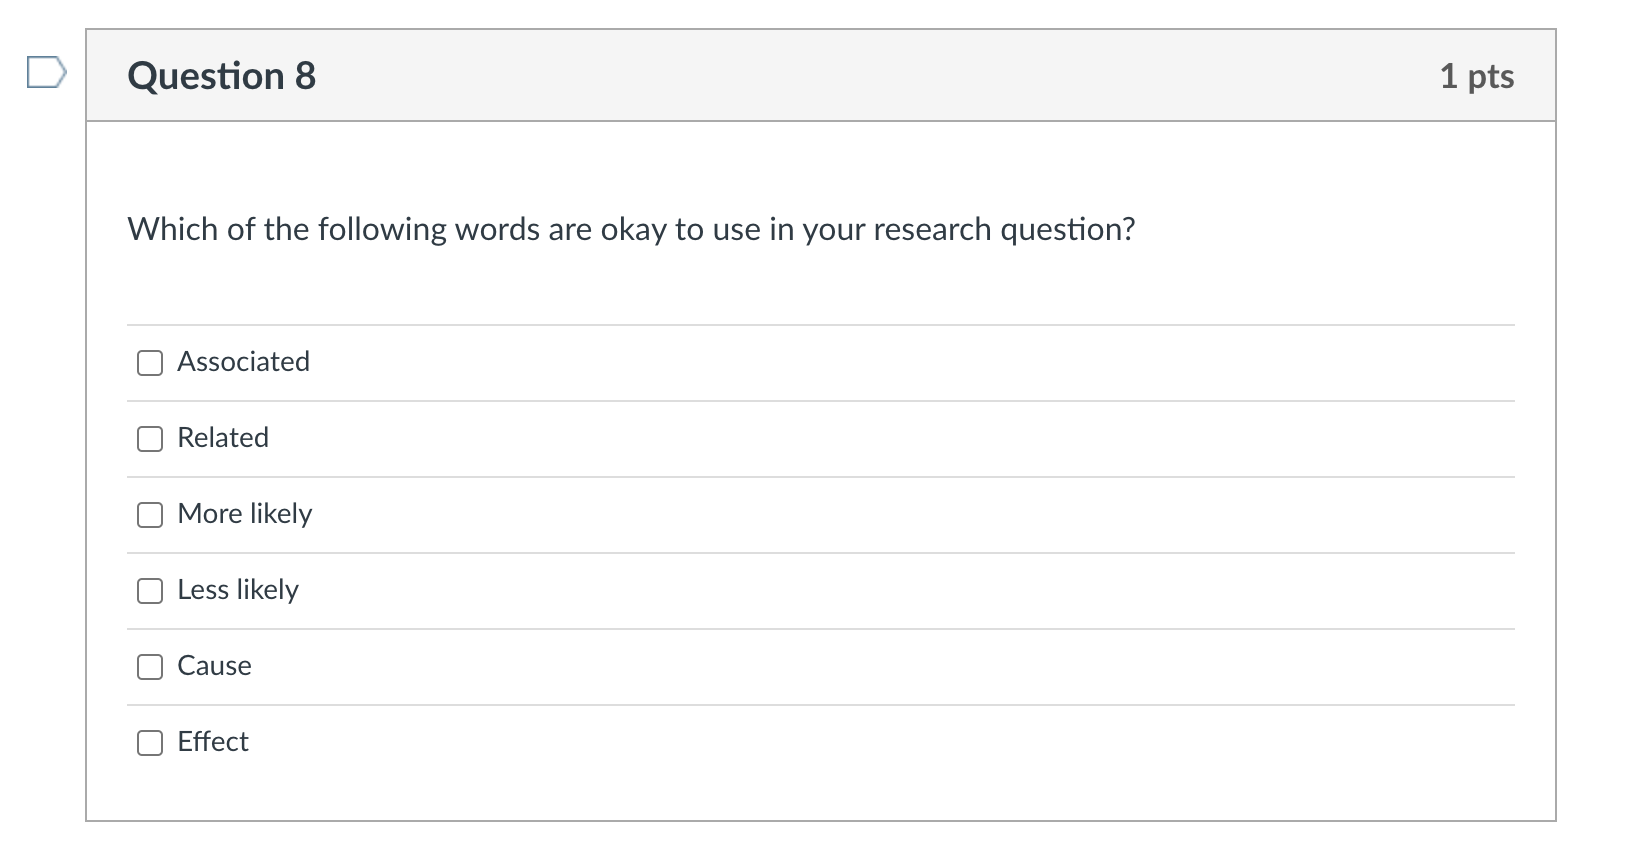
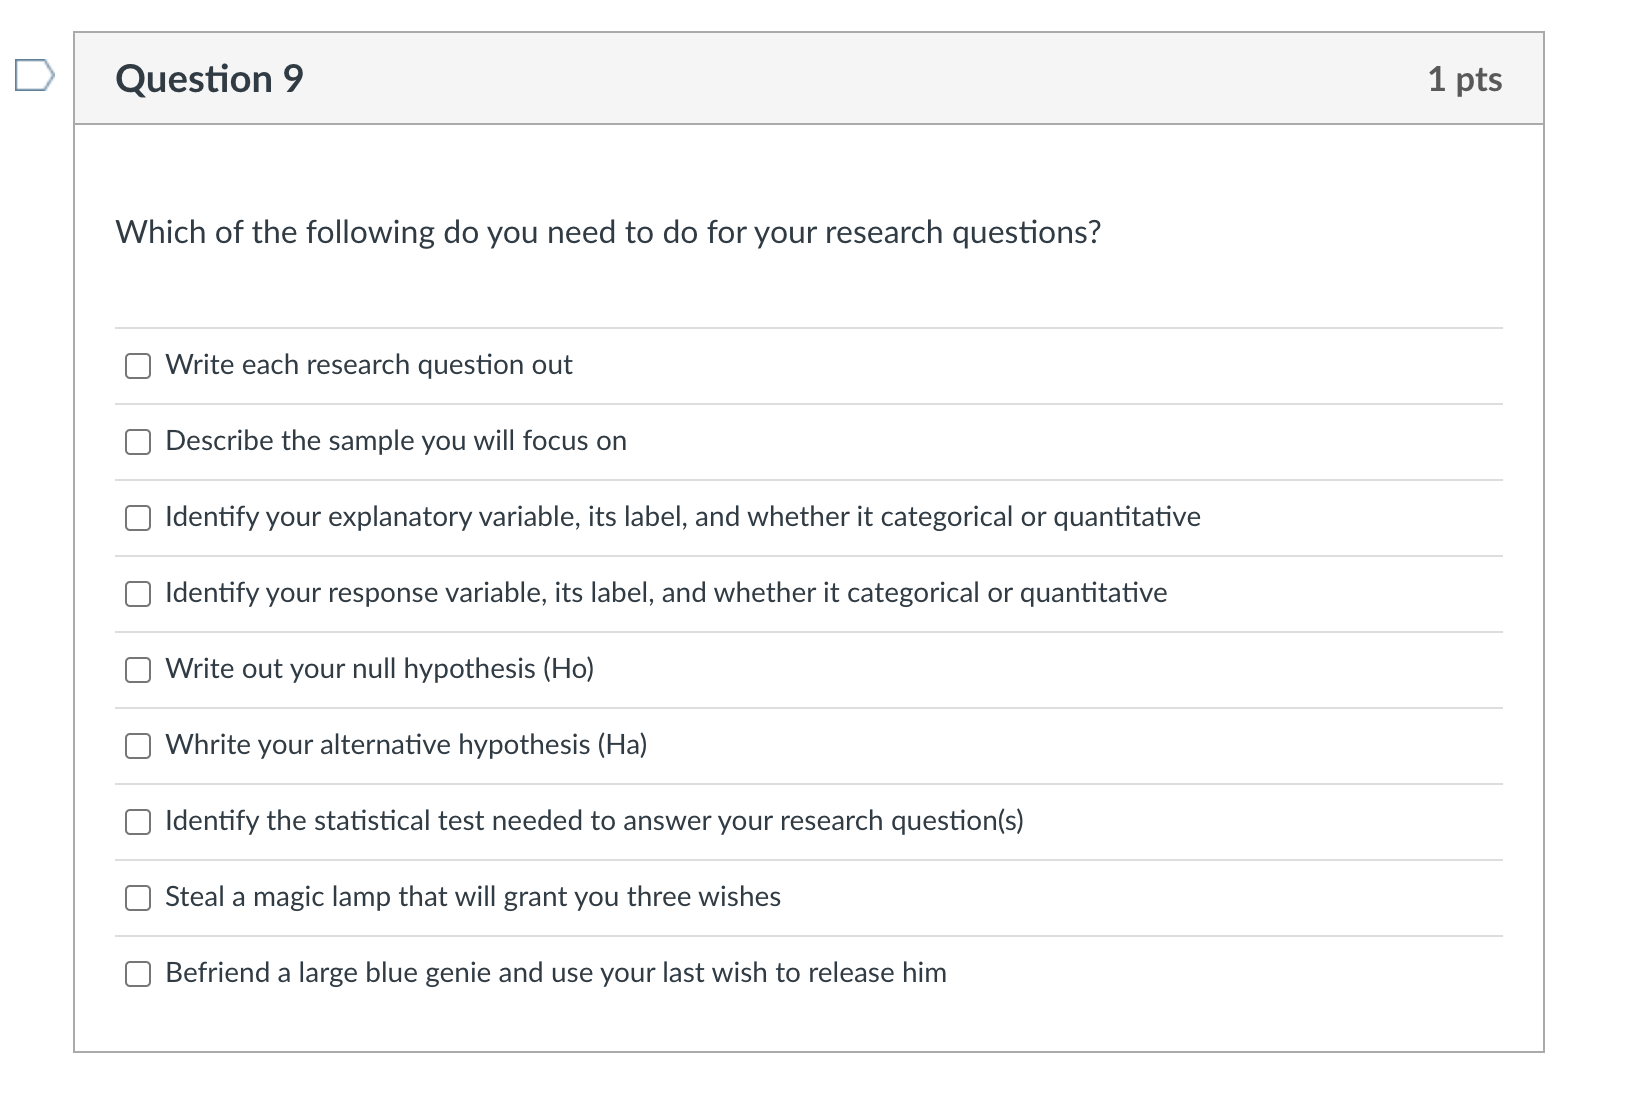
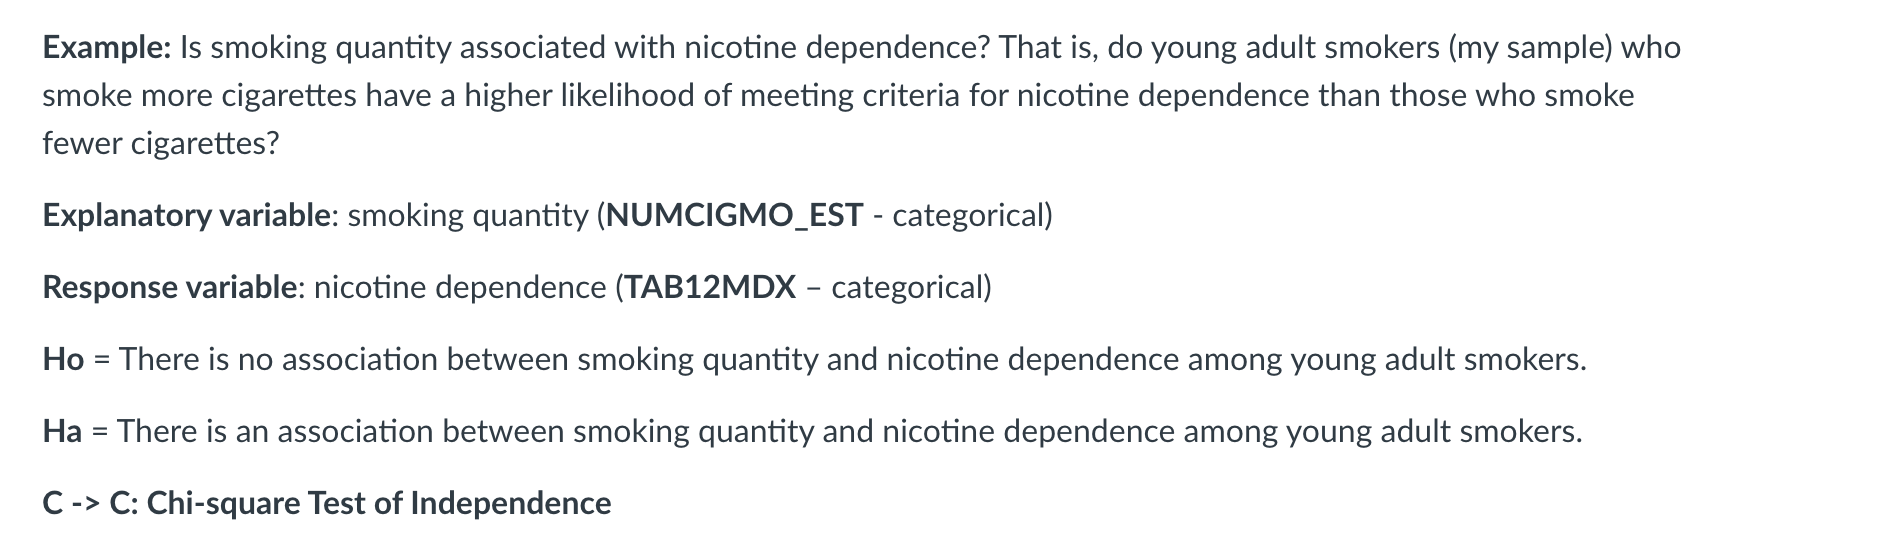
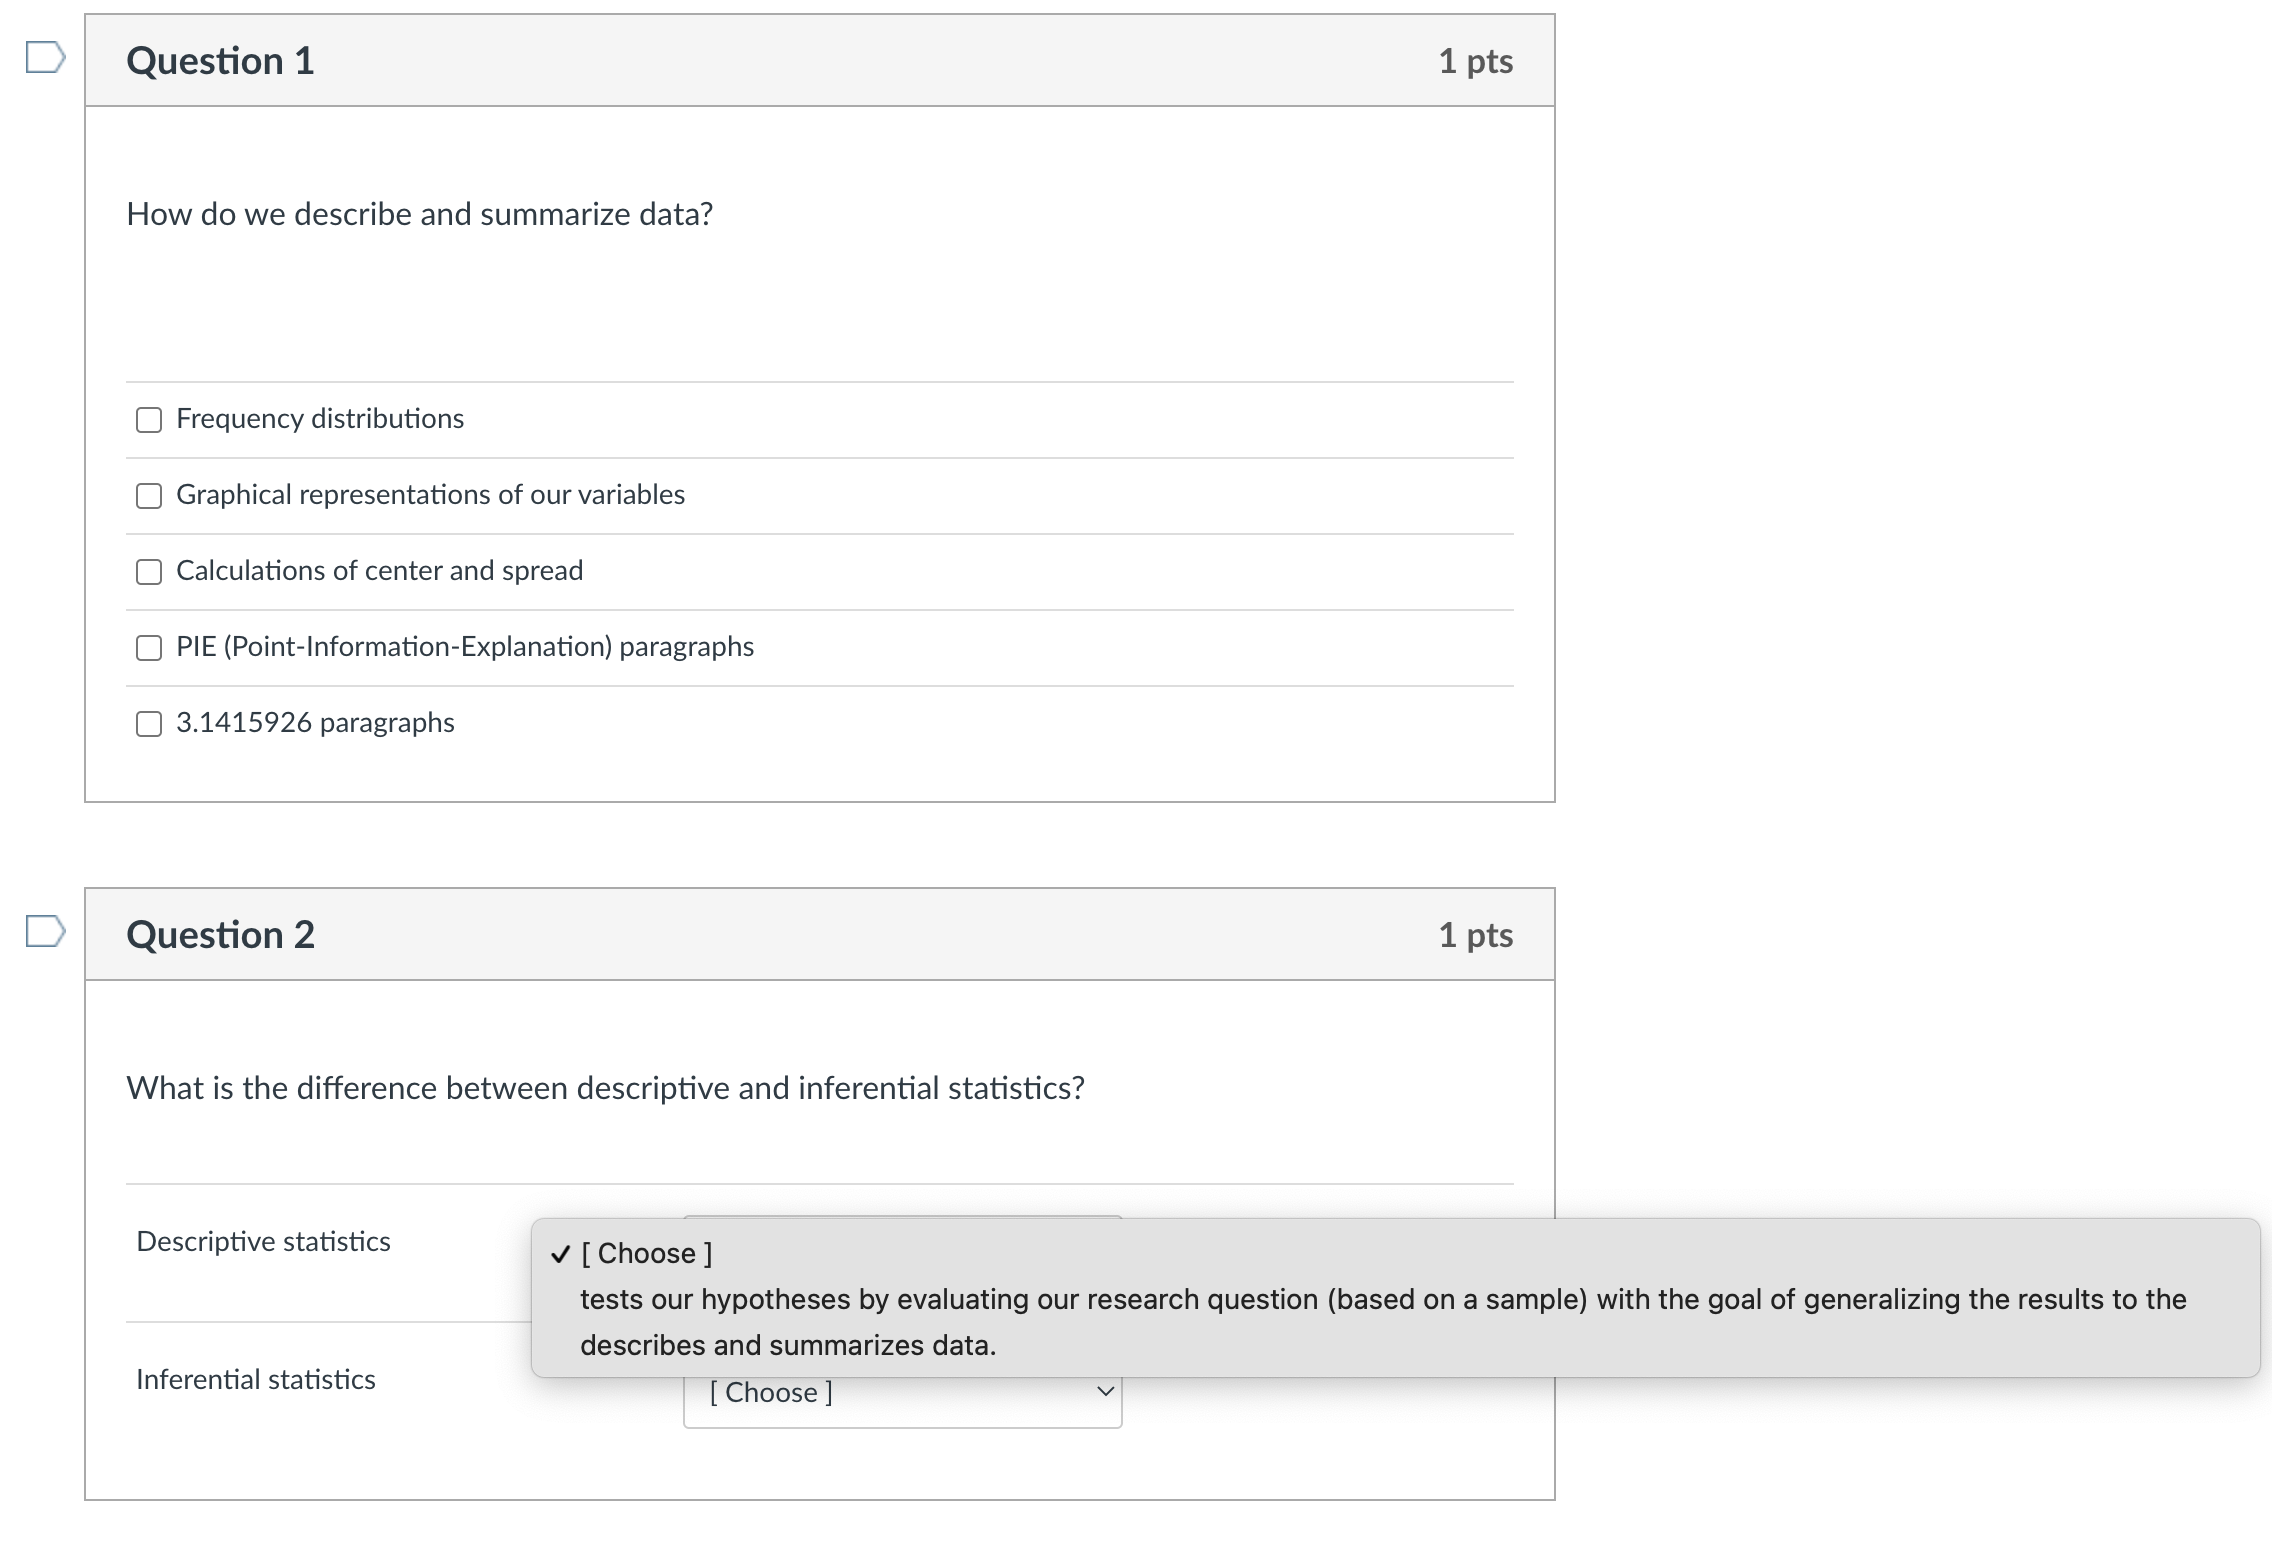
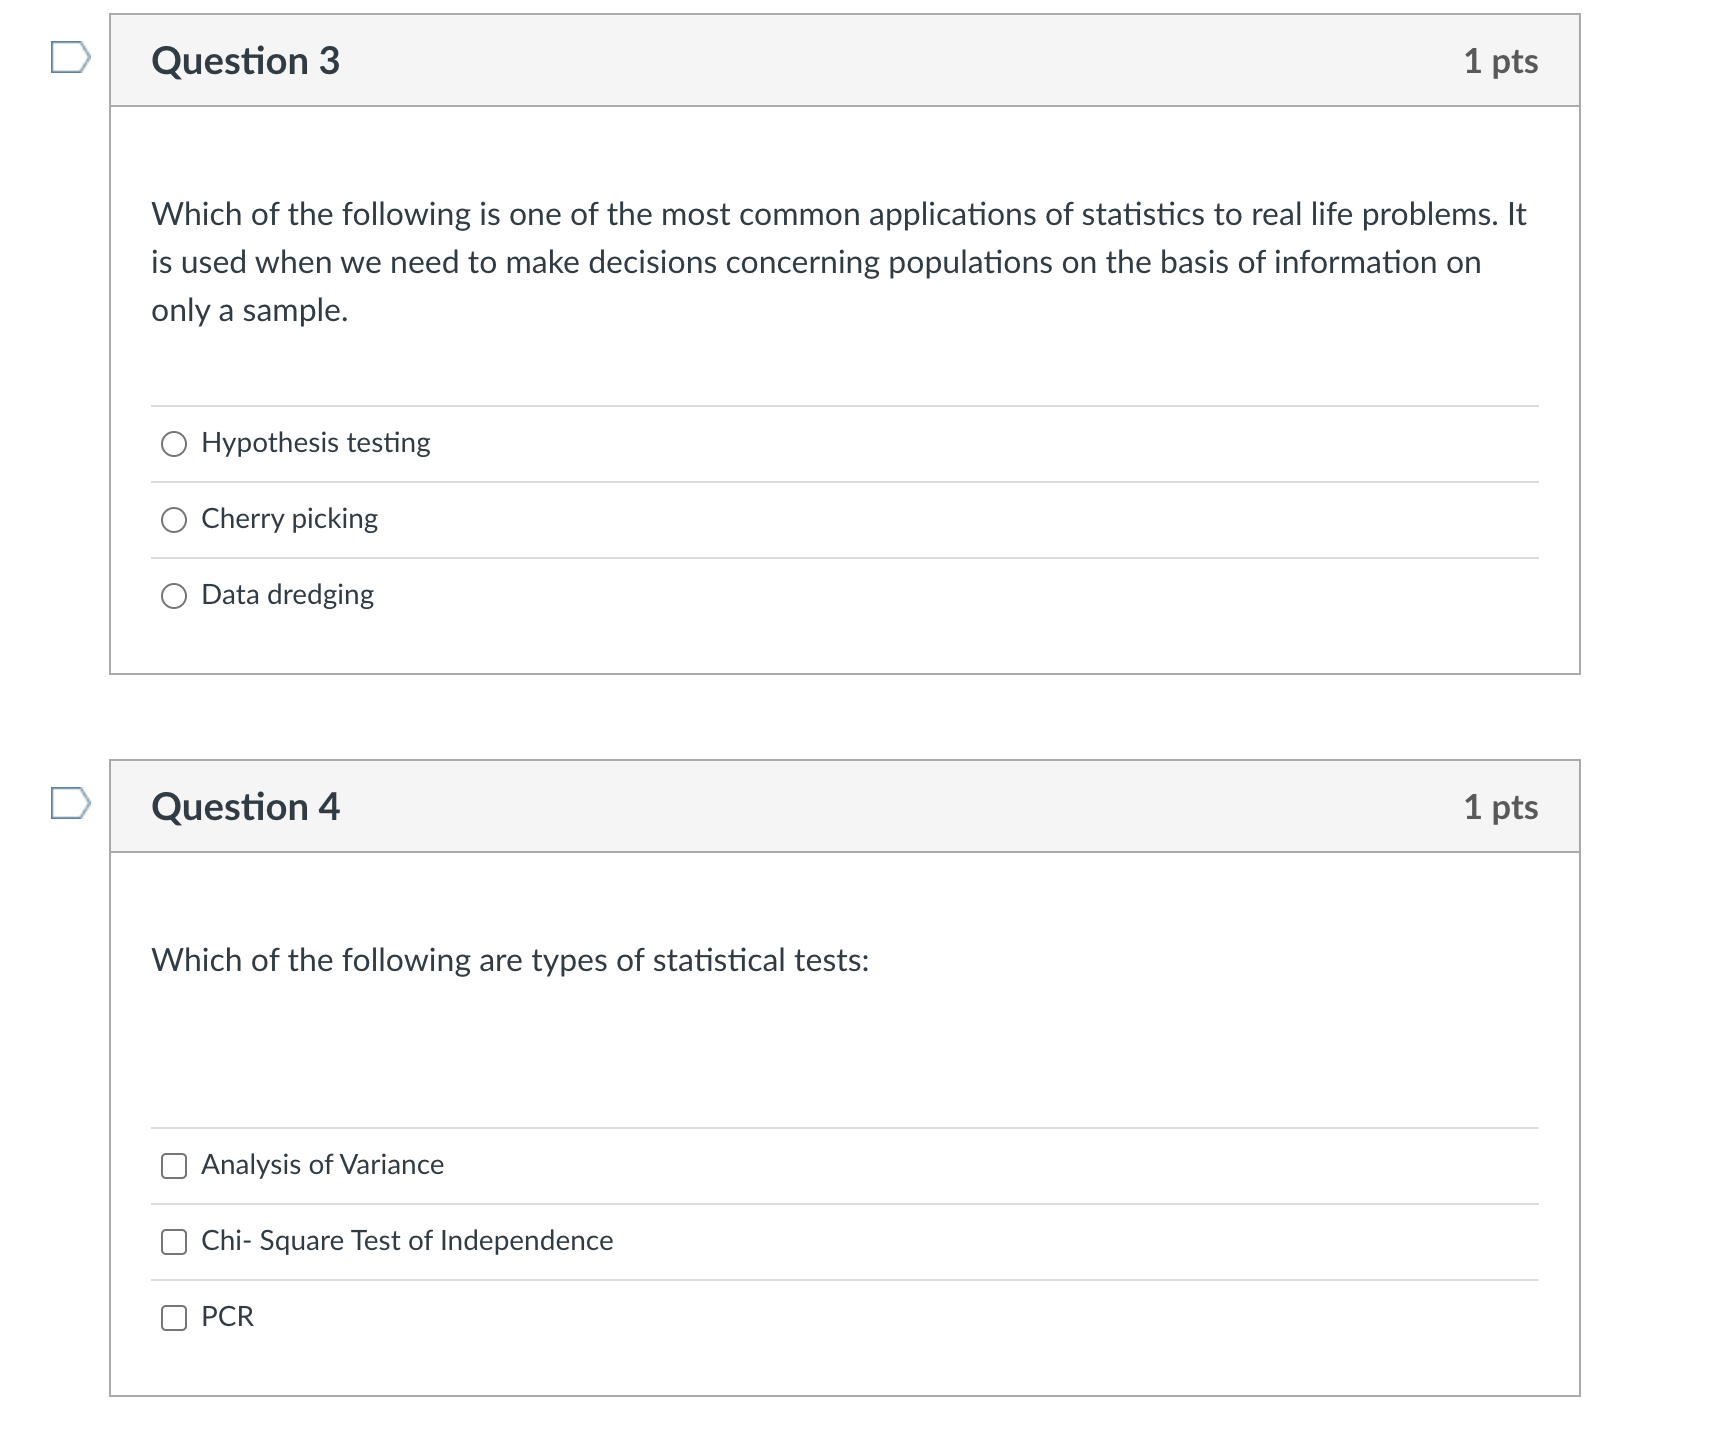
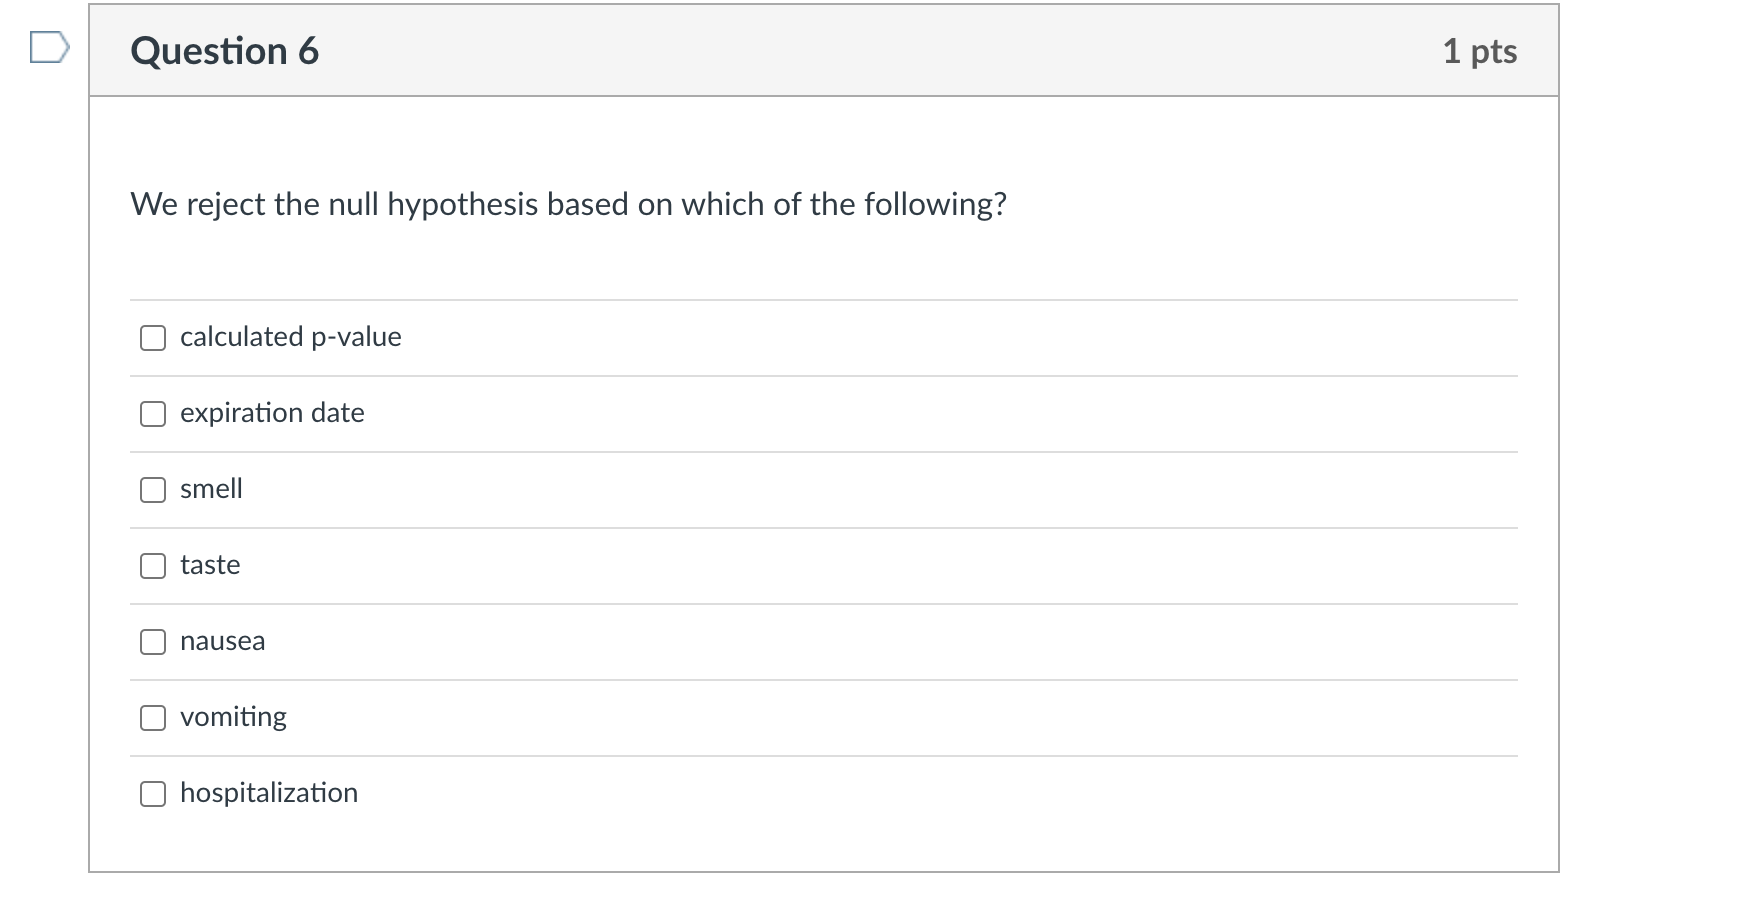
Instructions wwwwww h //\\ //\\ //\\ //\\ h \"Statistics may be dened as 'a body of methods for making wise decisions in the face of uncertainty." W.A. Wallis 8.1 Overview Thus far, we have focused on descriptive statistics. Through our examination of frequency distributions, graphical representations of our variables, and calculations of center and spread, the goal has been to describe and summarize data. Now you will be introduced to inferential statistics. In addition to describing data, inferential statistics allow us to directly test our hypotheses by evaluating our research question (based on a sample) with the goal of generalizing the results to the larger population from which the sample was drawn. Hypothesis testing is one of the most common applications of statistics to real life problems. It is used when we need to make decisions concerning populations on the basis of information on only a sample. Avariety of statistical tests are used to arrive at these decisions (e.g., Analysis of Variance, Chi- Square Test of Independence, etc.). 8.2 Lesson Learn about the 4 steps involved in hypothesis testing: specifying the null (Ho) and alternate (Ha) hypotheses; choosing a sample; assessing the evidence; and drawing conclusions. Identify the null hypothesis (Ho) and alternative hypotheses (Ha) for your research question(s). See how to calculate how likely it is to get data like that observed when H0 is true. Understand when to reject the null hypothesis based on the calculated p-value. Compare your calculated p- value to the standard alpha level (a = .05 or 5%). Consider how this allows us to make inferences about the population based on our sample. Click M r: to watch the video lesson. 8.3 Assignment Write out your research question(s). Be sure to remove any words suggesting cause and effect (i.e., use the words associated, related, more likely, less likely, etc.). Also describe the sample you will focus on (e.g., representative sample of U5. adolescents, representative sample of US. adults, individuals who have smoked in their lifetime, older adults between 60 and 95, etc.). Which topic or construct is your explanatory variable? Which is your response variable? What is the variable name of your explanatory and response variables (i.e., your data management variables)? Next, label your explanatory and response variables as categorical or quantitative. If the variable can be either categorical or quantitative (e.g. it is ordered with higher numbers meaning more and lower numbers meaning less) write \"categorical\" if it is your explanatory variable and "quantitative" if it is your response variable. Finally, write the null and alternate hypothesis for your research question. Which statistical test will you need to run in order to answer your research question? Example: ls smoking quantity associated with nicotine dependence? That is, do young adult smokers (my sample) who smoke more cigarettes have a higher likelihood of meeting criteria for nicotine dependence than those who smoke fewer cigarettes? Example: ls smoking quantity associated with nicotine dependence? That is, do young adult smokers (my sample) who smoke more cigarettes have a higher likelihood of meeting criteria for nicotine dependence than those who smoke fewer cigarettes? Explanatory variable: smoking quanty (NUMCIGMO_EST - categorical) Response variable: nicotine dependence (TAB12MDX categorical) Ho = There is no association between smoking quantity and nicotine dependence among young adult smokers. Ha = There is an association between smoking quantity and nicotine dependence among young adult smokers. C -> C: Chi-square Test of Independence Question 1 1 pts How do we describe and summarize data? Frequency distributions Graphical representations of our variables Calculations of center and spread PIE (Point-Information-Explanation) paragraphs 3.1415926 paragraphs Question 2 1 pts What is the difference between descriptive and inferential statistics? Descriptive statistics I J [Choose] tests our hypotheses by evaluating our research question (based on a sample) with the goal of generalizing the results to the describes and summarizes data. lnferentlal statistics [ Choose ] V D Question 3 1 pts Which of the following is one of the most common applications of statistics to real life problems. It is used when we need to make decisions concerning populations on the basis of information on only a sample. 0 Hypothesis testing 0 Cherry picking 0 Data dredging D Question 4 1 pts Which of the following are types of statistical tests: C] Analysis of Variance C] Chi- Square Test of Independence C] PCR \fD Question 6 We reject the null hypothesis based on which of the following? :] calculated p-value :] expiration date :] smell :] taste :] nausea :] vomiting :] hospitalization D Question 7 1 pts What is the standard alpha level to which we compare our calculated p-value? O 0.99 O 0.95 O 0.90 O 0.10 O 0.05 O 0.01 Which of the following words are okay to use in your research question? :] Associated :] Related :] More likely :] Less likely :] Cause :] Effect Question 9 1 pts Which of the following do you need to do for your research questions? C Write each research question out C Describe the sample you will focus on C Identify your explanatory variable, its label, and whether it categorical or quantitative C Identify your response variable, its label, and whether it categorical or quantitative [: Write out your null hypothesis (Ho) [: Whrite your alternative hypothesis (Ha) [: Identify the statistical test needed to answer your research questionls) C Steal a magic lamp that will grant you three wishes C Befriend a large blue genie and use your last wish to release him
Step by Step Solution
There are 3 Steps involved in it
Step: 1
Get Instant Access to Expert-Tailored Solutions
See step-by-step solutions with expert insights and AI powered tools for academic success
Step: 2
Step: 3
Ace Your Homework with AI
Get the answers you need in no time with our AI-driven, step-by-step assistance