

Question
Instructions: - You should submit your answer as a Jupiter Notebook file only. Submit only the .ipynb file that should contain all your answers for
Instructions:
- You should submit your answer as a Jupiter Notebook file only. Submit only the .ipynb file that should contain all your answers for this assignment.
- This is an individual assignment. Any two identical answers will be graded ZERO automatically.
- Assignments submitted after due date will NOT be accepted.
Date Set Description:
We'll be using the "mammographic masses" public dataset from the UCI repository. This data contains 961 instances of masses detected in mammograms, and contains the following attributes:
1. BI-RADS assessment: 1 to 5 (ordinal)
2. Age: patient's age in years (integer)
3. Shape: mass shape: round=1 oval=2 lobular=3 irregular=4 (nominal)
4. Margin: mass margin: circumscribed=1 microlobulated=2 obscured=3 ill-defined=4 spiculated=5 (nominal)
5. Density: mass density high=1 iso=2 low=3 fat-containing=4 (ordinal)
6. Severity: benign=0 or malignant=1 (binominal) (The dependent variable)
BI-RADS is an assessment of how confident the severity classification is; it is not a "predictive" attribute and so we will discard it. The age, shape, margin, and density attributes are the features that we will build our model with, and "severity" is the classification we will attempt to predict based on those attributes.
Although "shape" and "margin" are nominal data types, which sklearn typically doesn't deal with well, they are close enough to ordinal that we shouldn't just discard them. The "shape" for example is ordered increasingly from round to irregular.
Note: You may use pandas, numpy, sklearn or any essential python package you need.
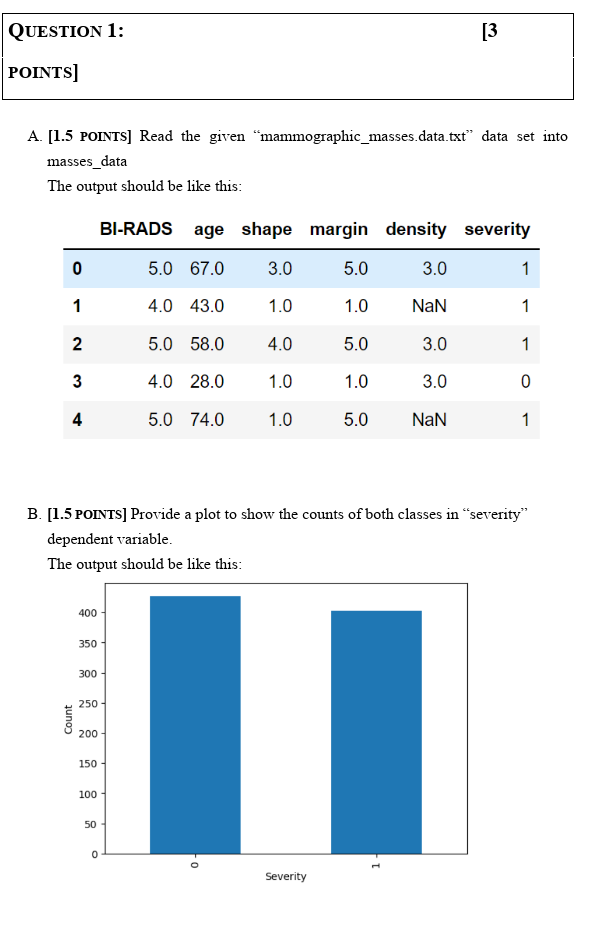
A. [1.5 PoINTS] Read the given "mammographic_masses.data.txt" data set into masses_data The output should be like this: B. [1.5 POINTS] Provide a plot to show the counts of both classes in "severity" dependent variable. The output should be like this
Step by Step Solution
There are 3 Steps involved in it
Step: 1

Get Instant Access to Expert-Tailored Solutions
See step-by-step solutions with expert insights and AI powered tools for academic success
Step: 2

Step: 3
Ace Your Homework with AI
Get the answers you need in no time with our AI-driven, step-by-step assistance
Get Started
Privacy In Statistical Databases International Conference Psd 2022 Paris France September 21 23 2022 Proceedings Lncs 13463
Authors: Josep Domingo-Ferrer ,Maryline Laurent
1st Edition
3031139445, 978-3031139444