

Question
Integrated circuits are manufactured on silicon wafers through a process that involves a series of steps.An experiment was carried out the effect on the yield
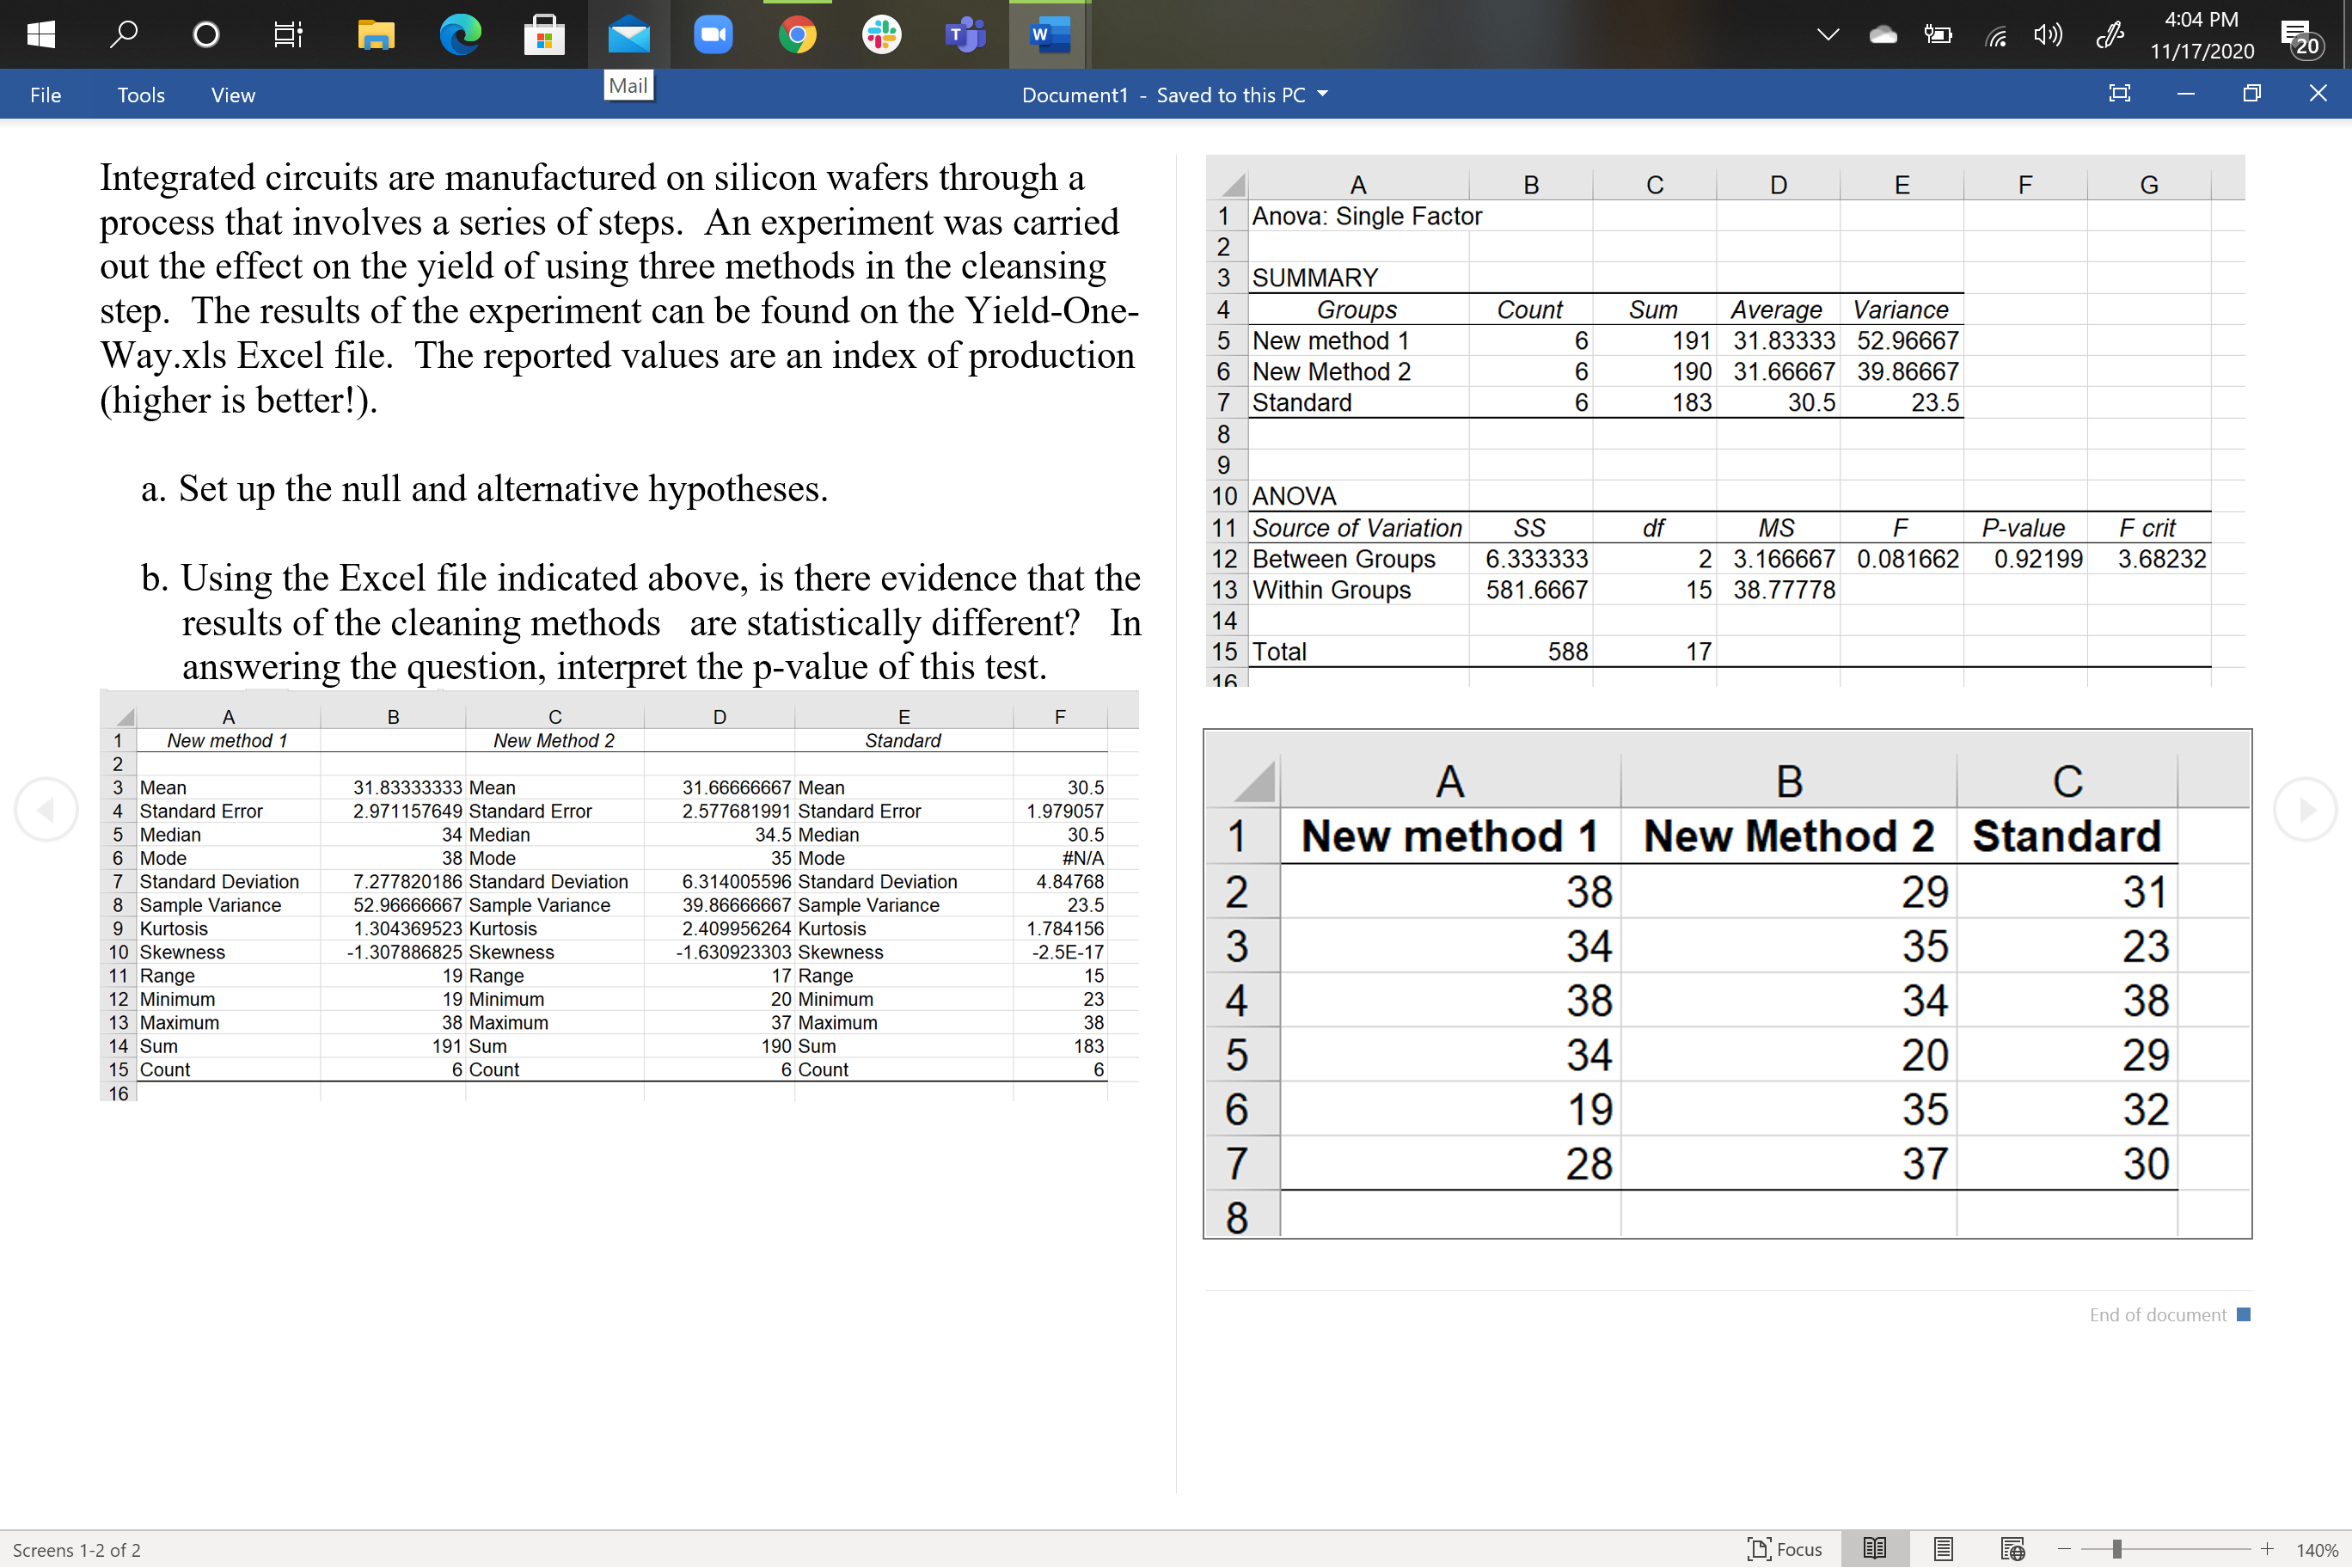
Integrated circuits are manufactured on silicon wafers through a process that involves a series of steps.An experiment was carried out the effect on the yield of using three methods in the cleansing step.The results of the experiment can be found on the Yield-OneWay.xls Excel file (attached).The reported values are an index of production (higher is better!).
a.Set up the null and alternative hypotheses.
b.Using the Excel file indicated above, is there evidence that the results of the cleaning methods are statistically different? In answering the question, interpret the p-value of this test.
Step by Step Solution
There are 3 Steps involved in it
Step: 1

Get Instant Access to Expert-Tailored Solutions
See step-by-step solutions with expert insights and AI powered tools for academic success
Step: 2

Step: 3
Ace Your Homework with AI
Get the answers you need in no time with our AI-driven, step-by-step assistance
Get Started
Core Connections Algebra 2
Authors: Leslie Dietiker, Judy Kysh, Tom Sallee, Brian Hoey
Student Edition
1603281150, 978-1603281157