Question
The Starbucks integrative case provides you with an opportunity to apply the entire six-step analysis framework of this textbook to Starbucks, an interesting, profitable, and
The Starbucks integrative case provides you with an opportunity to apply the entire six-step analysis framework of this textbook to Starbucks, an interesting, profitable, and growing company. Beginning in Chapter 1, and following each chapter of the book, we use the Starbucks Integrative Case to illustrate and apply all of the tools of financial statements analysis and valuation throughout the book. This chapter illustrates the six-step forecasting procedure by applying it to PepsiCo to develop complete financial statement forecasts through Year + 5. In this portion of the integrative case, we rely on our analysis of Starbucks? financial statements through fiscal Year 4 and apply the six-step forecasting procedure of this chapter to develop complete forecasts of Starbucks' financial statements through Year +5.
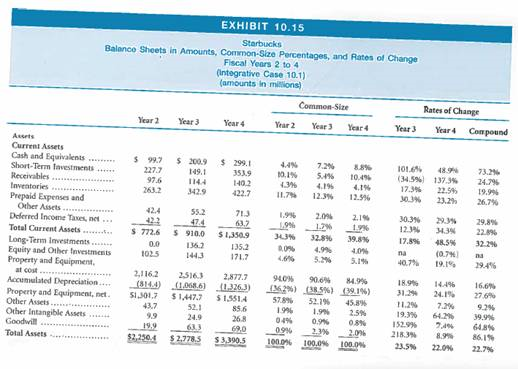
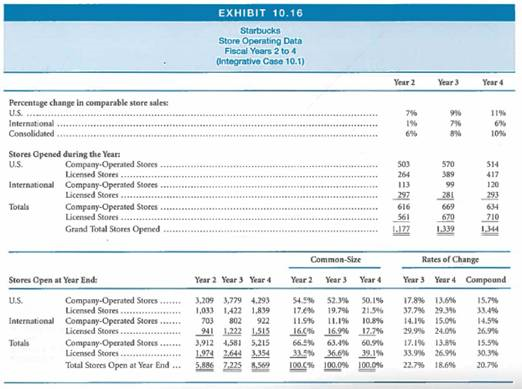
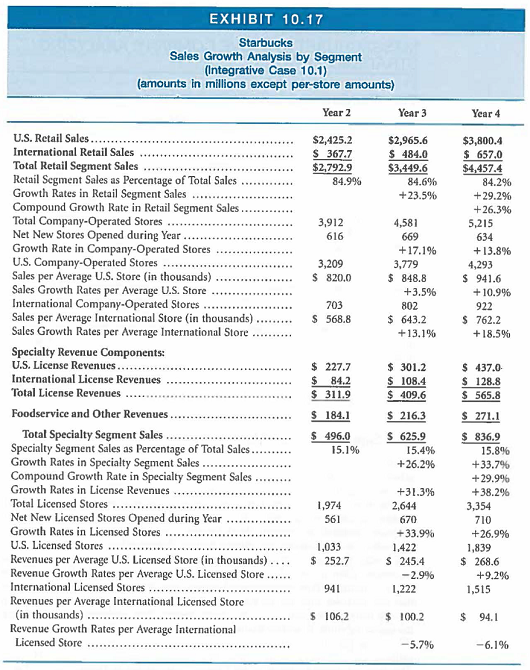
Exhibits 10.14 and 10.15 provide Starbucks? financial statements for fiscal Year 2 through fiscal Year 4, in dollar amounts, common-size, and rate-of-change formats. These data report the financial performance and position of Starbucks and summarize the results of Starbucks' operating, investing, and financing activities. The common-size and rate-of-change balance sheets and income statements for Starbucks highlight relations among accounts and trends over time. Exhibit 10.16 provides store operating data through fiscal Year 4 for Starbucks, including same-store sales growth rates, new store openings, and total numbers of stores open. In addition, Exhibit 10.17 provides a detailed breakdown of Starbucks' revenues and revenue growth by segment and by store. You may wish to refer back to Exhibits 1.24 through 1.28 (Chapter 1) for additional financial statement data. You may also wish to refer back to Exhibit 4.45 (Chapter 4) for a ratio analysis of Starbucks' financial statements. All of the other chapters throughout the text have also illustrated accounting-quality issues and financial statement analysis issues for Starbucks. All of these data and analyses now come into play in this portion of the comprehensive Star bucks case, as we develop forecasts of Star bucks' future financial statements.
Required
Develop complete forecasts of Starbucks? income statements, balance sheets, and statements of cash flows for Years + 1 through +5. As illustrated in this chapter, develop objective and unbiased forecast assumptions for all of Starbucks' future operating, investing, and financing activities through Year + 5, and capture those expectations using financial statement forecasts.
Specifications
a. Build your own spreadsheets to develop and capture your financial statement fore9 cast assumptions and data for Starbucks. Building your own financial statement forecast spreadsheets is an extremely valuable learning exercise in its own right. You can use the examples we developed throughout this chapter for PepsiCo as a model to follow in building your own spreadsheets. If you have already had the learning experience of building your own forecasting spreadsheets, you can build your financial statement forecasts using the FSAP template for Starbucks that accompanies this book. You can download the blank FSAP template from the book?s website address: www.thomsonedu.com/accountinglstickney. Input the accounting data for Starbucks from Exhibits 1.24 to 1.26 (Chapter 1) into the Data Spreadsheet within the blank FSAP template.
b. Starbucks? operating, investing, and financing activities revolve primarily around opening and operating company-owned retail coffee shops in the United States and around the world. Starbucks' annual reports provide useful data on the number of company-operated stores Starbucks owns, the new stores it opens each year, and the same-store sales growth rates. These data reveal that Starbucks' revenues and revenue growth rates differ significantly across different segments and across U.S. versus international stores. Use these data, summarized in Exhibits 10.13 and 10.14, as a basis to forecast (a) Starbucks' future sales from existing stores, (b) the number of new company-operated stores Starbucks will open, (c) future sales from new stores, and (d) capital expenditures for new stores.
c. Starbucks? business also involves generating revenues from licensing Starbucks stores and selling Starbucks coffee and other products through foodservice accounts, grocery stores, warehouse clubs, etc. Use the data in Exhibits 10.13 and 10.14 to build forecasts of future revenues from licensing activities and foodservice and other activities.
d. Use your forecasts of capital expenditures for new stores, together with Starbucks? data on property, plant, and equipment and depreciation, to build a schedule to forecast property, plant, and equipment, and depreciation expense, as described in the chapter and illustrated in Appendix C for PepsiCo.
e. Starbucks appears to use marketable securities as the flexible financial account for balancing the balance sheet. If we follow Starbucks? practice and use marketable securities to balance the balance sheet forecasts, under reasonable forecast assumptions the forecast amounts for marketable securities will become excessively large proportions of total assets by Year +4 and + 5. Therefore, build your financial statement forecasts using dividends as the flexible financial account. This assumption does not match Starbucks' policy through Year 4 of paying zero dividends, But as Starbucks matures and continues to produce excess capital, you can predict that it will initiate a dividend payment policy (or equivalently, a share repurchase policy) to begin distributing excess capital to common equity shareholders.
f. Save your forecast spreadsheets. In subsequent chapters, we will continue to use Starbucks as a comprehensive integrative case. In those chapters, we will apply the valuation models to your forecasts of Starbucks? future earnings, cash flows, and dividends to assess Starbucks' share value.


Interest and Other Income, net Other Gains (Losses) Income before Income Taxes Provision for Income Taxes. Net Income Net Income per Share Basic. Diluted ******* 9.3 11.6 14.1 13.4 0.0 0.0 $ 336.9 $ 434.0 S 622.3 (125.5) (167.1) (231.8) $211.4 $266.9 $390.6 $ 0.55 $ 0.53 $ 0.68 $ 0.98 $ 0.66 $ 0.95 0.3% 0.3% 0.3% 0.0% 0.4% 0,0% 10.2% 10.6% 11.8% (3.8%) (4.1%) (4.4%) 6.4% 6.5% 7.4% 25.0% 21.7% (100,0%) na 28.8% 43.4% 33.2% 38.7% 26.3% 46.3% 23.3% (100,0%) 35.9% 35.9% 35.9% EXHIBIT 10.15 Starbucks Balance Sheets in Amounts, Common-Size Percentages, and Rates of Change Fiscal Years 2 to 4 (Integrative Case 10.1) (amounts in millions) Assets Current Assets Cash and Equivalents......... Short-Term Investments...... Receivables Inventories Prepaid Expenses and Other Assets Deferred Income Taxes, net... Total Current Assets.......... Long-Term Investments....... Equity and Other Investments Property and Equipment. at cost....... Accumulated Depreciation.... Property and Equipment, net. Other Assets..... Other Intangible Assets Goodwill Total Assets Year 2 $ 99.7 227.7 97.6 263.2 42.4 423 $ 772.6 0.0 102.5 2,116.2 (814.4) $1,301,7 43,7 9.9 19.9 $2.250.4 PATEICA Year 3 $ 200.9 149.1 1144 342.9 55.2 47.4 $ 910.0 136.2 1443 Year 4 52.1 24.9 63.3 $2.778.5 $299.1 353.9 140,2 422.7 71.3 63.7 $1,350.9 135.2 171.7 2516.3 2,877.7 (1.068.6) (1.3263) $1,4477 $1,551.4 85.6 26.8 69,0 $3,300,5 Year 2 4.4% 10.1% 4.3% 11.7% 34.3% 2.0% 1,9% 1.7% 32.8% 0.0% 46% Common-Size Year 3 7.2% 5.4% 4.196 12.3% 57.8% 1.99 04% 0.9% 100.0% Year 4 52.1% 1.9% 0.9% 2.3% 100.0% 8.8% 10.4% 4.1% 12.5% 4.9% 4.0% 5.2% 5.1% 940% 90.6% 84.9% (26.2%) (38.5%) (39.1%) AN 2.1% 1.9% 39.8% 45.8% 2.5% 0.8% 2.09 100.0% Year 3 Rates of Change Year 4 Compound 101.6% 48.9% (34.5%) 137.3% 17.3% 30.3% 11.2% 19.3% 152.9% 218.3% 23.5% 22.5% 23.2% 30.3% 29.3% 12.3% 34.3% 17.8% 48.5% na (0.7%) 40.7% 19.1% 18.9% 14.4% 24.1% 7.2% 64.2% 7,4% 8.9% 22.0% 73.2% 24.7% 19.9% 26.7% 29.8% 22.8% 32.2% na 29.4% 16.6% 27,6% 9.2% 39.9% 64.8% 86.1% 22.7% Percentage change in comparable store sales: U.S. International Consolidated Stores Opened during the Year: U.S. International Totals Stores Open at Year End: U.S. International Company-Operated Stores Licensed Stores... Company-Operated Stores Licensed Stores... Company-Operated Stores Licensed Stores..... Grand Total Stores Opened.... Totals Company-Operated Stores....... Licensed Stores Company-Operated Stores Licensed Stores.. Company-Operated Stores Licensed Stores.. Total Stores Open at Year End ... EXHIBIT 10.16 Starbucks Store Operating Data Fiscal Years 2 to 4 Ontegrative Case 10.1) Year 2 Year 3 Year 4 3,209 3,779 4.293 1,033 1,422 1,839 703 802 922 941 1,222 1,515 3,912 4,581 5,215 1.974 2644 3.354 5,886 7,225 8,569 Common-Size Year 2 54.9% 52.3% 50.1% 17.6% 19,7% 21.3% 11.9% 11.1% 10.8% 16.0% 16.9% 17.7% 66.5% 63.4% 60.9% 33.9% 36.69% 39.1% 100.0% 100.0% 100.0% Year 3 Year 4 Year 2 7% 196 6% 503 264 113 616 561 1.177 Year 3 Year 3 996 796 8% 570 389 99 281 669 670 1.339 Rates of Change 17.8 % 13.6% 37.7% 29.3% 14.1% 15,0% 29.9% 24.0% Year 4 Year 4 Compound 17.1% 13.8% 33.9% 26.9% 22.7% 18.6% 11% 6% 10% 514 417 120 293 634 710 1,344 15.7% 33.4% 14.5% 26.9% 15.5% 30.3% 20.7% EXHIBIT 10.17 Starbucks Sales Growth Analysis by Segment (Integrative Case 10.1) (amounts in millions except per-store amounts) U.S. Retail Sales.. International Retail Sales Total Retail Segment Sales Retail Segment Sales as Percentage of Total Sales Growth Rates in Retail Segment Sales Compound Growth Rate in Retail Segment Sales Total Company-Operated Stores Net New Stores Opened during Year Growth Rate in Company-Operated Stores U.S. Company-Operated Stores.... Sales per Average U.S. Store (in thousands) Sales Growth Rates per Average U.S. Store International Company-Operated Stores Sales per Average International Store (in thousands) Sales Growth Rates per Average International Store Specialty Revenue Components: U.S. License Revenues. International License Revenues Total License Revenues Foodservice and Other Revenues Total Specialty Segment Sales Specialty Segment Sales as Percentage of Total Sales. Growth Rates in Specialty Segment Sales Compound Growth Rate in Specialty Segment Sales Growth Rates in License Revenues Total Licensed Stores Net New Licensed Stores Opened during Year Growth Rates in Licensed Stores U.S. Licensed Stores .... Revenues per Average U.S. Licensed Store (in thousands) Revenue Growth Rates per Average U.S. Licensed Store. International Licensed Stores Revenues per Average International Licensed Store (in thousands) Revenue Growth Rates per Average International Licensed Store Year 2 $2,425.2 S 367.7 $2,792.9 84.9% 3,912 616 3,209 $ 820.0 703 $ 568.8 $ 227.7 $ 84.2 $ 311.9 $184.1 $ 496.0 15.1% 1,974 561 1,033 $ 252.7 941 $ 106.2 Year 3 $2,965.6 $ 484.0 $3,449.6 84.6% +23.5% 4,581 669 +17.1% 3,779 $848.8 +3.5% 802 $ 643.2 +13.1% $ 301.2 $ 108.4 $ 409.6 $ 216.3 $ 625.9 15.4% +26.2% +31.3% 2,644 670 +33.9% 1,422 S 245.4 -2.9% 1,222 $ 100.2 -5.7% Year 4 $3,800.4 $ 657.0 $4,457.4 84.2% +29.2% +26.3% 5,215 634 + 13.8% 4,293 $ 941.6 +10.9% 922 $ 762.2 +18.5% $ 437.0- $ 128.8 $ 565.8 $ 271.1 $ 836.9 15.8% +33.7% +29.9% +38.2% 3,354 710 +26.9% 1,839 $268.6 +9.2% 1,515 $ 94.1 -6.1%
Step by Step Solution
There are 3 Steps involved in it
Step: 1
Step 1 of 6 FIFO First In First Out Under this method cost of goods sold is the earliest purchases a...
Get Instant Access to Expert-Tailored Solutions
See step-by-step solutions with expert insights and AI powered tools for academic success
Step: 2

Step: 3

Ace Your Homework with AI
Get the answers you need in no time with our AI-driven, step-by-step assistance
Get Started


