

Answered step by step
Verified Expert Solution
Question
1 Approved Answer
Interacting with the dashboard Who are the top 5 customers? (Hint: Select the Autosort button next to the Customer Name header in the table showing
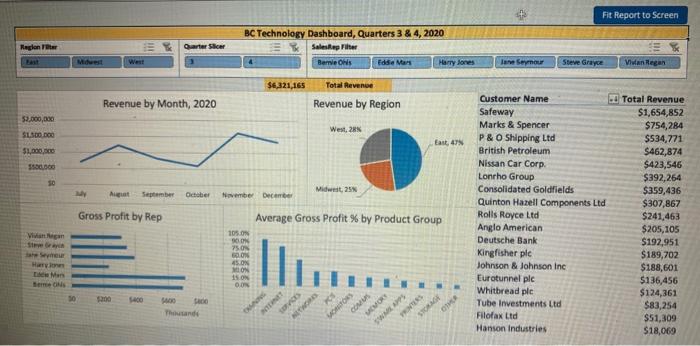
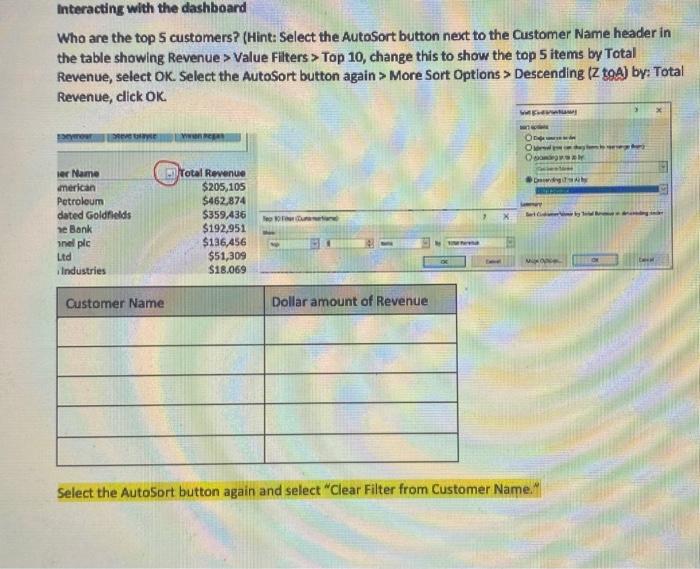
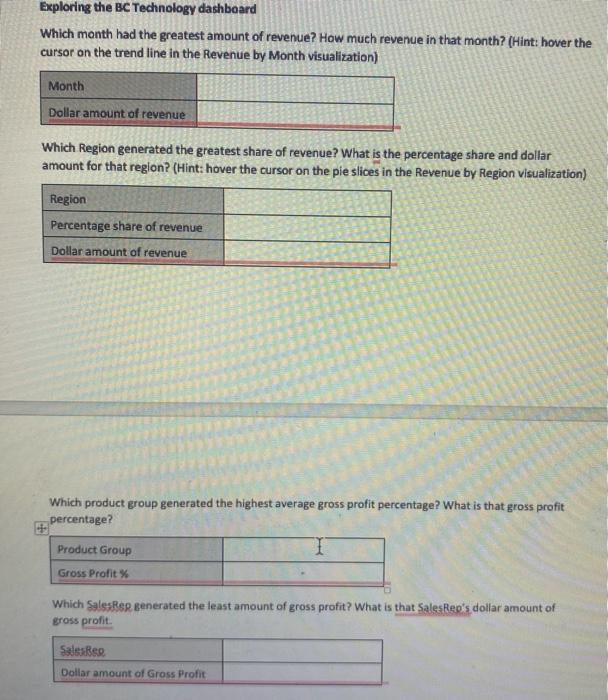
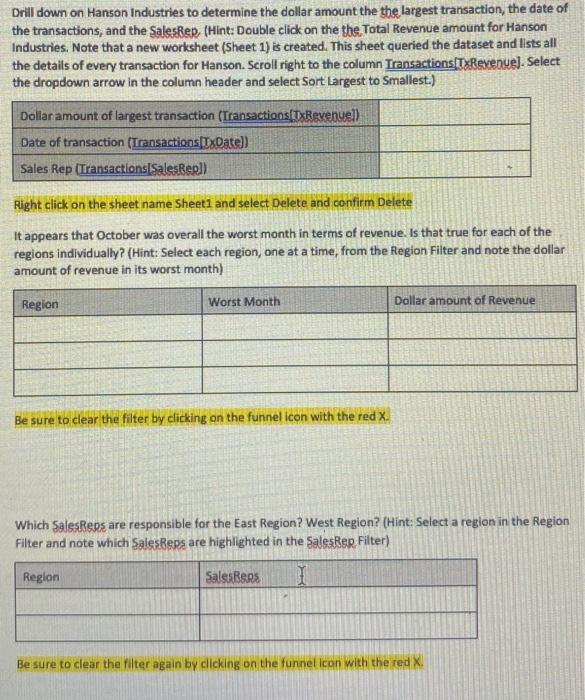
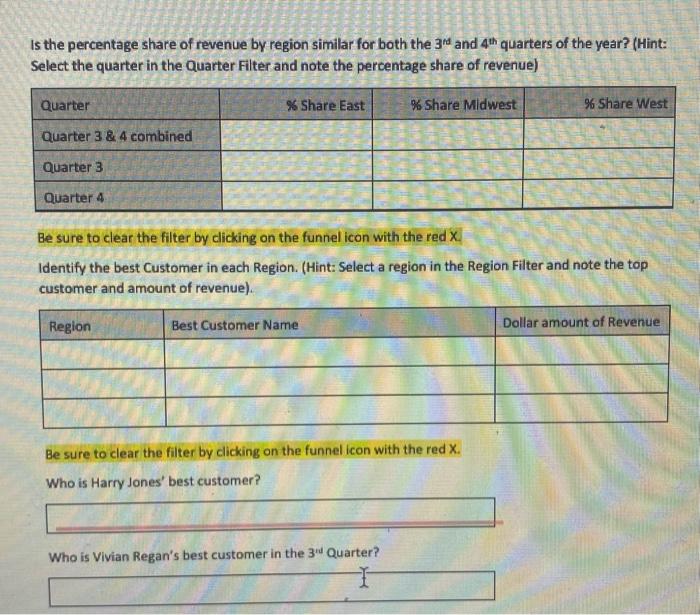 Interacting with the dashboard Who are the top 5 customers? (Hint: Select the Autosort button next to the Customer Name header in the table showing Revenue > Value Fliters > Top 10, change this to show the top 5 items by Total Revenue, select OK. Select the Autosort button again > More Sort Options > Descending (Z tgA) by: Total Revenue, click OK. Select the AutoSort button again and select "Clear Filter from Customer Name:" Exploring the BCTechnology dashboard Which month had the greatest amount of revenue? How much revenue in that month? (Hint: hover the cursor on the trend line in the Revenue by Month visualization) Which Region generated the greatest share of revenue? What is the percentage share and dollar amount for that region? (Hint: hover the cursor on the pie slices in the Revenue by Region visualization) Which product group generated the highest average gross profit percentage? What is that gross profit percentage? Which Salsskep generated the least amount of gross profit? What is that Salespep's dollar amount of gross profit. Drill down on Hanson Industries to determine the dollar amount the the largest transaction, the date of the transactions, and the Saleskep. (Hint: Double click on the the Total Revenue amount for Hanson Industries. Note that a new worksheet (Sheet 1) is created. This sheet queried the dataset and lists all the details of every transaction for Hanson. Scroll right to the column Iransactions[TxRevenue]. Select the dropdown arrow in the column header and select Sort Largest to Smallest.) Right click on the sheet name Sheet1 and select Delete and confirm Delete It appears that October was overall the worst month in terms of revenue. Is that true for each of the regions individually? (Hint: Select each region, one at a time, from the Region Filter and note the dollar amount of revenue in its worst month) Be sure to clear the filter by clicking on the funnel icon with the red X. Which SalesReps are responsible for the East Region? West Region? (Hint: Select a region in the Region Filter and note which Saleskeps are highlighted in the Salespep. Filter) Be sure to clear the filter again by clicking on the funnel lcon with the red X. Is the percentage share of revenue by region similar for both the 3is and 4th quarters of the year? (Hint: Select the quarter in the Quarter Filter and note the percentage share of revenue) Be sure to clear the filter by clicking on the funnel icon with the red x. Identify the best Customer in each Region. (Hint: Select a region in the Region Filter and note the top customer and amount of revenue). Be sure to clear the filter by clicking on the funnel icon with the red X. Who is Harry Jones' best customer? Who is Vivian Regan's best customer in the 3nd Quarter? Interacting with the dashboard Who are the top 5 customers? (Hint: Select the Autosort button next to the Customer Name header in the table showing Revenue > Value Fliters > Top 10, change this to show the top 5 items by Total Revenue, select OK. Select the Autosort button again > More Sort Options > Descending (Z tgA) by: Total Revenue, click OK. Select the AutoSort button again and select "Clear Filter from Customer Name:" Exploring the BCTechnology dashboard Which month had the greatest amount of revenue? How much revenue in that month? (Hint: hover the cursor on the trend line in the Revenue by Month visualization) Which Region generated the greatest share of revenue? What is the percentage share and dollar amount for that region? (Hint: hover the cursor on the pie slices in the Revenue by Region visualization) Which product group generated the highest average gross profit percentage? What is that gross profit percentage? Which Salsskep generated the least amount of gross profit? What is that Salespep's dollar amount of gross profit. Drill down on Hanson Industries to determine the dollar amount the the largest transaction, the date of the transactions, and the Saleskep. (Hint: Double click on the the Total Revenue amount for Hanson Industries. Note that a new worksheet (Sheet 1) is created. This sheet queried the dataset and lists all the details of every transaction for Hanson. Scroll right to the column Iransactions[TxRevenue]. Select the dropdown arrow in the column header and select Sort Largest to Smallest.) Right click on the sheet name Sheet1 and select Delete and confirm Delete It appears that October was overall the worst month in terms of revenue. Is that true for each of the regions individually? (Hint: Select each region, one at a time, from the Region Filter and note the dollar amount of revenue in its worst month) Be sure to clear the filter by clicking on the funnel icon with the red X. Which SalesReps are responsible for the East Region? West Region? (Hint: Select a region in the Region Filter and note which Saleskeps are highlighted in the Salespep. Filter) Be sure to clear the filter again by clicking on the funnel lcon with the red X. Is the percentage share of revenue by region similar for both the 3is and 4th quarters of the year? (Hint: Select the quarter in the Quarter Filter and note the percentage share of revenue) Be sure to clear the filter by clicking on the funnel icon with the red x. Identify the best Customer in each Region. (Hint: Select a region in the Region Filter and note the top customer and amount of revenue). Be sure to clear the filter by clicking on the funnel icon with the red X. Who is Harry Jones' best customer? Who is Vivian Regan's best customer in the 3nd Quarter
Step by Step Solution
There are 3 Steps involved in it
Step: 1

Get Instant Access to Expert-Tailored Solutions
See step-by-step solutions with expert insights and AI powered tools for academic success
Step: 2

Step: 3
Ace Your Homework with AI
Get the answers you need in no time with our AI-driven, step-by-step assistance
Get Started
Managing The Audit Function A Corporate Audit Department Procedures Guide
Authors: Michael P. Cangemi, Tommie W. Singleton
3rd Edition
0471281190, 978-0471281191