Answered step by step
Verified Expert Solution
Question
1 Approved Answer
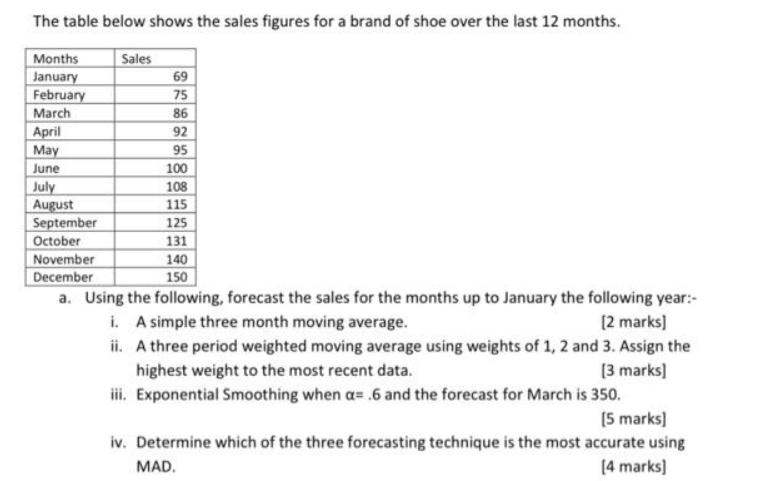
The table below shows the sales figures for a brand of shoe over the last 12 months. Sales Months January February March April May

The table below shows the sales figures for a brand of shoe over the last 12 months. Sales Months January February March April May June July August September October 69 75 86 92 95 100 108 115 125 131 140 150 November December a. Using the following, forecast the sales for the months up to January the following year:- i. A simple three month moving average. [2 marks] ii. A three period weighted moving average using weights of 1, 2 and 3. Assign the highest weight to the most recent data. [3 marks] iii. Exponential Smoothing when a= .6 and the forecast for March is 350. [5 marks] iv. Determine which of the three forecasting technique is the most accurate using MAD. [4 marks]
Step by Step Solution
★★★★★
3.34 Rating (151 Votes )
There are 3 Steps involved in it
Step: 1
i A simple three month moving average January 793 February 813 March 873 April 927 May 947 June 993 ...
Get Instant Access to Expert-Tailored Solutions
See step-by-step solutions with expert insights and AI powered tools for academic success
Step: 2

Step: 3

Ace Your Homework with AI
Get the answers you need in no time with our AI-driven, step-by-step assistance
Get Started


