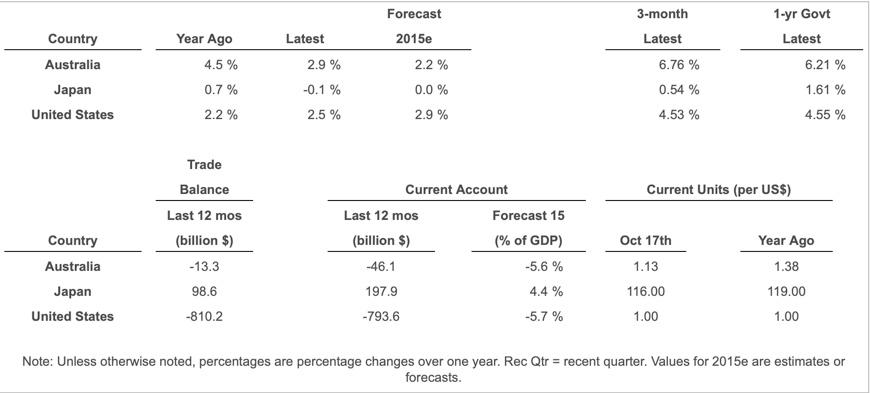
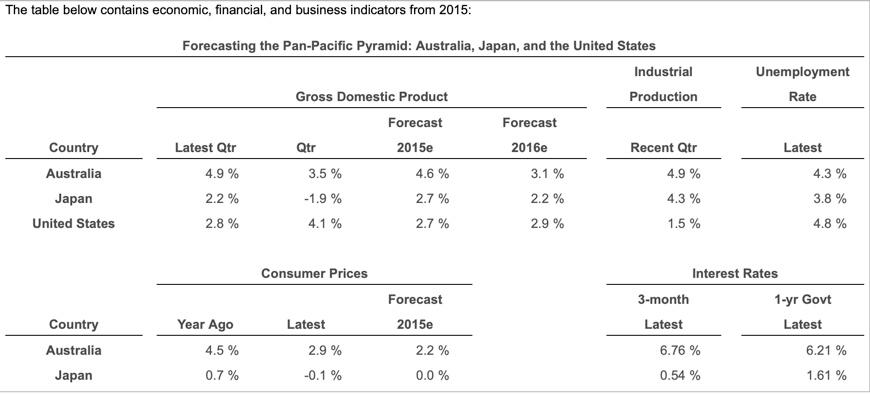
International Fischer Forecasts. Use the table containing economic, financial, and business indicators to answer the following questions. Assuming International Fischer-one version of Purchasing Power Parity-applies to the coming year, forecast the following future spot exchange rates using government bond rates for the respective country currencies: a. Japanese yen/U.S. dollar in one year b. Japanese yen/Australian dollar in one year c. Australian dollar/U.S. dollar in one year Assuming International Fischer-one version of Purchasing Power Parity-applies to the coming year, forecast the following future spot exchange rates using the government bond rates for the respective country currencies: a. Japanese yen/U.S. dollar in one year The future spot exchange rate for Japanese yen/U.S. dollar in one year is . (Round to two decimal places.) 1-yr Govt Latest Latest Country Australia Japan United States Year Ago 4.5 % 0.7 % 2.2% 2.9% -0.1 % Forecast 2015e 2.2% 0.0 % 2.9% 3-month Latest 6.76 % 0.54 % 4.53 % 6.21 % 1.61 % 4.55% 2.5 % Current Units (per US$) Country Australia Japan United States Trade Balance Last 12 mos (billion $) -13.3 98.6 -810.2 Current Account Last 12 mos Forecast 15 (billion $) (% of GDP) -46.1 -5.6 % 197.9 4.4 % -793.6 -5.7% Oct 17th 1.13 116.00 1.00 Year Ago 1.38 119.00 1.00 Note: Unless otherwise noted, percentages are percentage changes over one year. Rec Qtr = recent quarter. Values for 2015e are estimates or forecasts. The table below contains economic, financial, and business indicators from 2015: Unemployment Rate Forecasting the Pan-Pacific Pyramid: Australia, Japan, and the United States Industrial Gross Domestic Product Production Forecast Forecast Latest Qtr Qtr 2015e 2016e Recent Qtr 4.9% 3.5 % 4.6 % 3.1 % 4.9% 2.2 % -1.9% 2.7 % 2.2 % 4.3 % 2.8% 4.1 % 2.7 % 2.9 % 1.5 % Country Australia Japan United States Latest 4.3 % 3.8 % 4.8 % Consumer Prices Latest Country Australia Year Ago 4.5% 0.7 % Forecast 2015e 2.2 % 0.0 % Interest Rates 3-month 1-yr Govt Latest Latest 6.76 % 6.21 % 0.54 % 1.61 % 2.9% Japan -0.1 % International Fischer Forecasts. Use the table containing economic, financial, and business indicators to answer the following questions. Assuming International Fischer-one version of Purchasing Power Parity-applies to the coming year, forecast the following future spot exchange rates using government bond rates for the respective country currencies: a. Japanese yen/U.S. dollar in one year b. Japanese yen/Australian dollar in one year c. Australian dollar/U.S. dollar in one year Assuming International Fischer-one version of Purchasing Power Parity-applies to the coming year, forecast the following future spot exchange rates using the government bond rates for the respective country currencies: a. Japanese yen/U.S. dollar in one year The future spot exchange rate for Japanese yen/U.S. dollar in one year is . (Round to two decimal places.) 1-yr Govt Latest Latest Country Australia Japan United States Year Ago 4.5 % 0.7 % 2.2% 2.9% -0.1 % Forecast 2015e 2.2% 0.0 % 2.9% 3-month Latest 6.76 % 0.54 % 4.53 % 6.21 % 1.61 % 4.55% 2.5 % Current Units (per US$) Country Australia Japan United States Trade Balance Last 12 mos (billion $) -13.3 98.6 -810.2 Current Account Last 12 mos Forecast 15 (billion $) (% of GDP) -46.1 -5.6 % 197.9 4.4 % -793.6 -5.7% Oct 17th 1.13 116.00 1.00 Year Ago 1.38 119.00 1.00 Note: Unless otherwise noted, percentages are percentage changes over one year. Rec Qtr = recent quarter. Values for 2015e are estimates or forecasts. The table below contains economic, financial, and business indicators from 2015: Unemployment Rate Forecasting the Pan-Pacific Pyramid: Australia, Japan, and the United States Industrial Gross Domestic Product Production Forecast Forecast Latest Qtr Qtr 2015e 2016e Recent Qtr 4.9% 3.5 % 4.6 % 3.1 % 4.9% 2.2 % -1.9% 2.7 % 2.2 % 4.3 % 2.8% 4.1 % 2.7 % 2.9 % 1.5 % Country Australia Japan United States Latest 4.3 % 3.8 % 4.8 % Consumer Prices Latest Country Australia Year Ago 4.5% 0.7 % Forecast 2015e 2.2 % 0.0 % Interest Rates 3-month 1-yr Govt Latest Latest 6.76 % 6.21 % 0.54 % 1.61 % 2.9% Japan -0.1 %