

Answered step by step
Verified Expert Solution
Question
1 Approved Answer
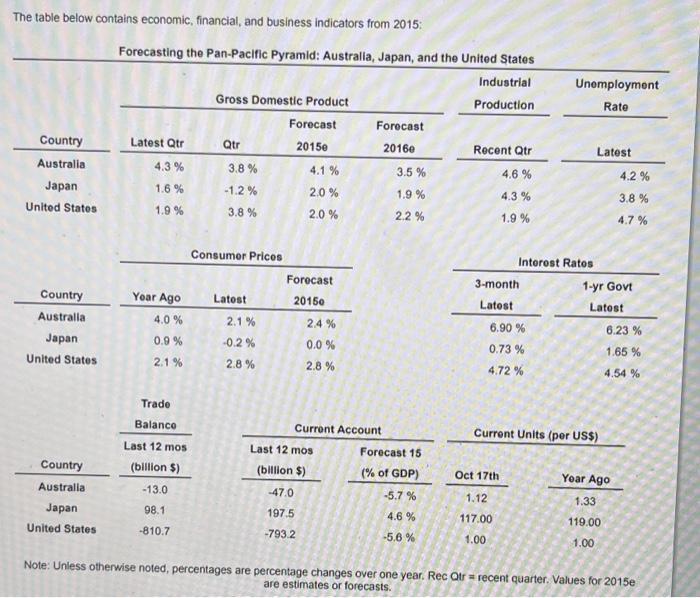
International Fischer Forecasts. Use the table containing economic, financial, and business indicators to answer the following questions. Assuming International Fischer-one version of Purchasing Power Parity-applies
Step by Step Solution
There are 3 Steps involved in it
Step: 1

Get Instant Access to Expert-Tailored Solutions
See step-by-step solutions with expert insights and AI powered tools for academic success
Step: 2

Step: 3
Ace Your Homework with AI
Get the answers you need in no time with our AI-driven, step-by-step assistance
Get Started
Restructuring And Innovation In Banking
Authors: Claudio Scardovi
1st Edition
331940203X, 978-3319402031