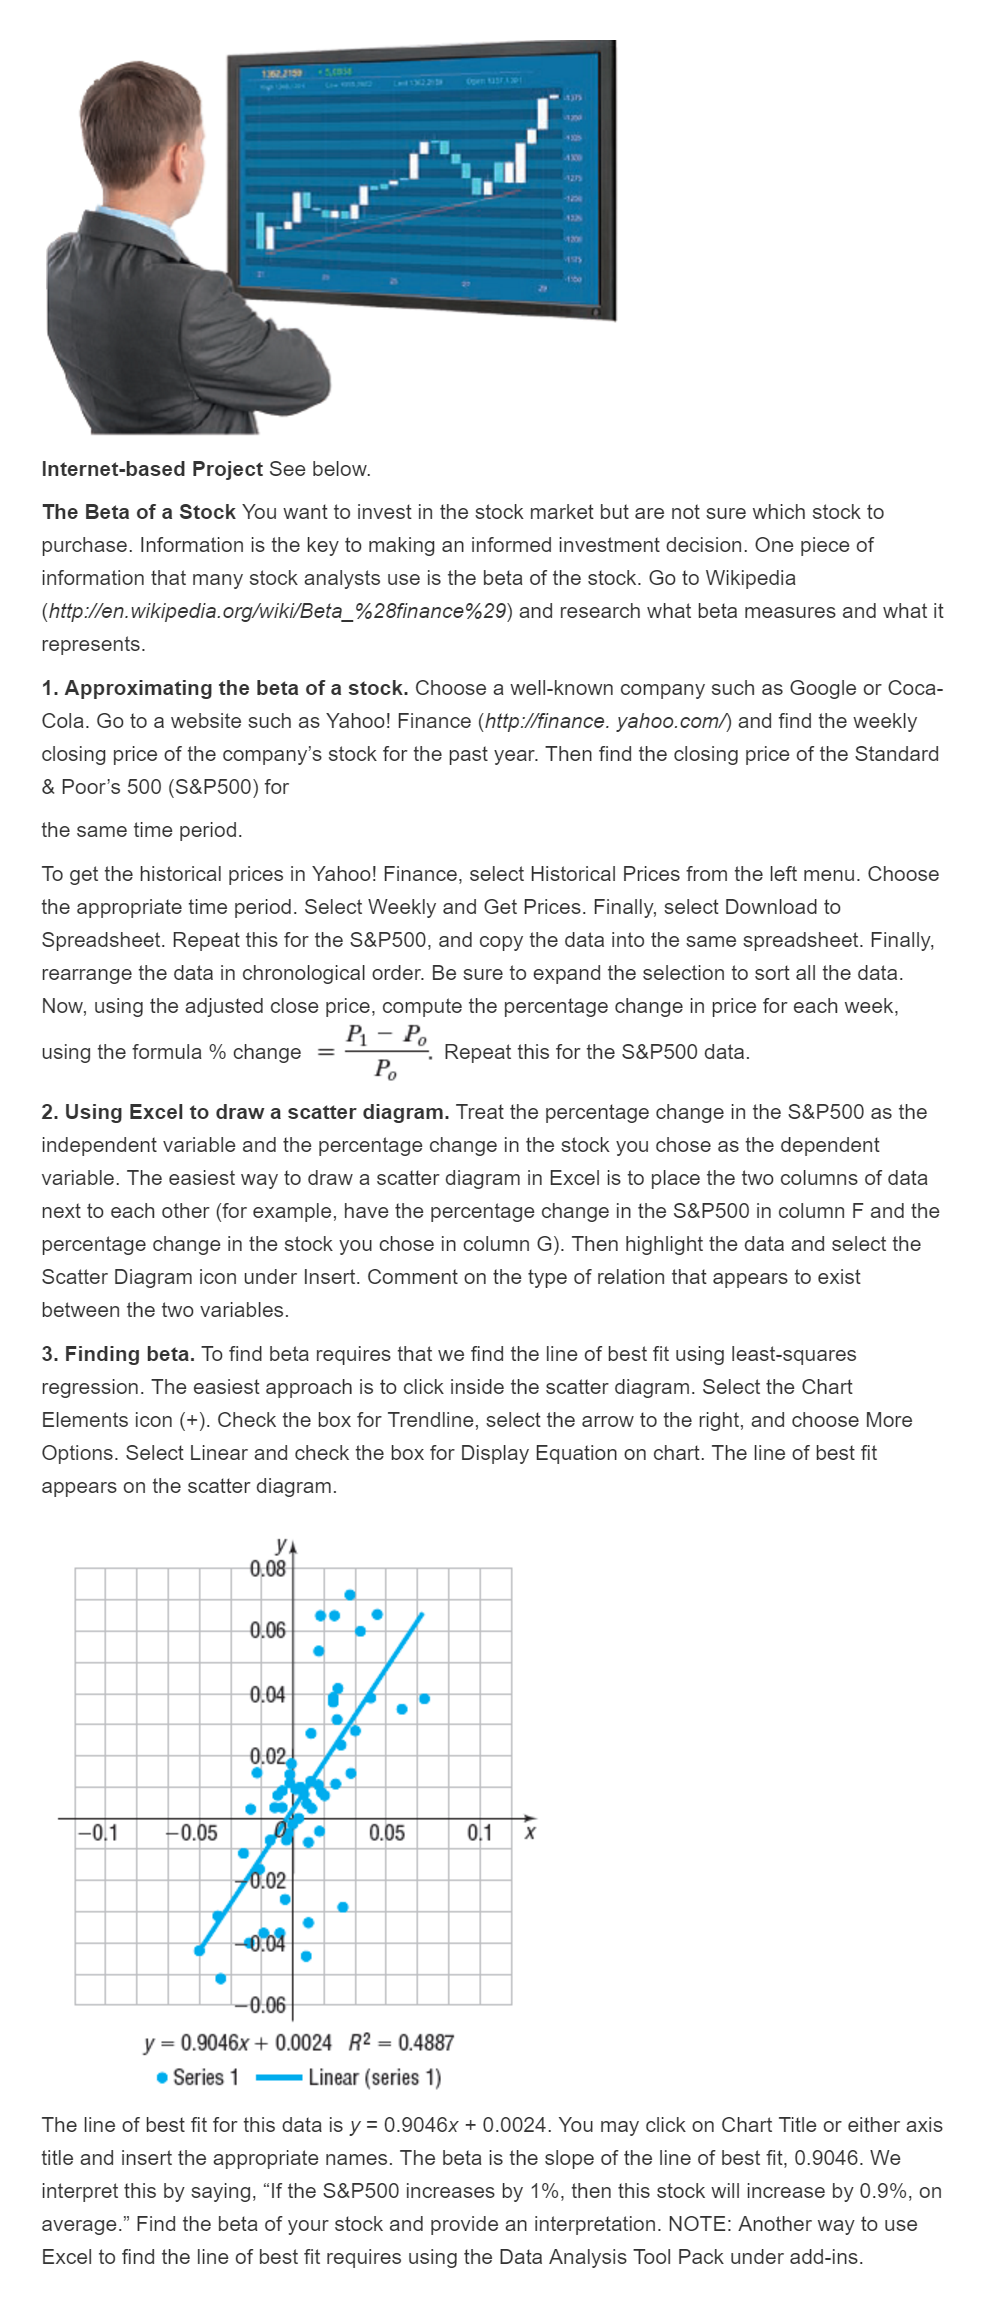
Internet-based Project See below. The Beta of a Stock You want to invest in the stock market but are not sure which stock to purchase. Information is the key to making an informed Investment decision. One piece of information that many stock analysts use is the beta of the stock. Go to Wikipedia (.http://en.wikipedia.org/wiki/Beta_%28finance%29) and research what beta measures and what it represents. 1. Approximating the beta of a stock. Choose a well-known company such as Google or Coca-Cola. Go to a website such as Yahoo! Finance (http://finance. yahoo.com/) and find the weekly closing price of the company's stock for the past year. Then find the closing price of the Standard & Poor's 500 (S&P500) for the same time period. To get the historical prices in Yahoo! Finance, select Historical Prices from the left menu. Choose the appropriate time period. Select Weekly and Get Prices. Finally, select Download to Spreadsheet. Repeat this for the S&P500, and copy the data into the same spreadsheet. Finally, rearrange the data in chronological order. Be sure to expand the selection to sort all the data. Now, using the adjusted close price, compute the percentage change in price for each week, using the formula % change = P_1 - P_0/P_0. Repeat this for the S&P500 data. Using Excel to draw a scatter diagram. Treat the percentage change In the S&P500 as the independent variable and the percentage change in the stock you chose as the dependent variable. The easiest way to draw a scatter diagram in Excel is to place the two columns of data next to each other (for example, have the percentage change in the S&P500 in column F and the percentage change in the stock you chose in column G). Then highlight the data and select the Scatter Diagram icon under Insert. Comment on the type of relation that appears to exist between the two variables. Finding beta. To find beta requires that we find the line of best fit using least-squares regression. The easiest approach is to click inside the scatter diagram. Select the Chart Elements icon (+). Check the box for Trendline, select the arrow to the right, and choose More Options. Select Linear and check the box for Display Equation on chart. The line of best fit appears on the scatter diagram. The line of best fit for this data is y = 0.9046x + 0.0024. You may click on Chart Title or either axis title and insert the appropriate names. The beta is the slope of the line of best fit, 0.9046. We interpret this by saying, "If the S&P500 increases by 1%, then this stock will increase by 0.9%, on average." Find the beta of your stock and provide an interpretation