

Question: Interpolation with Matlab A quantity y is known to depend on another quantity x. A set of corresponding values has been collected for and y
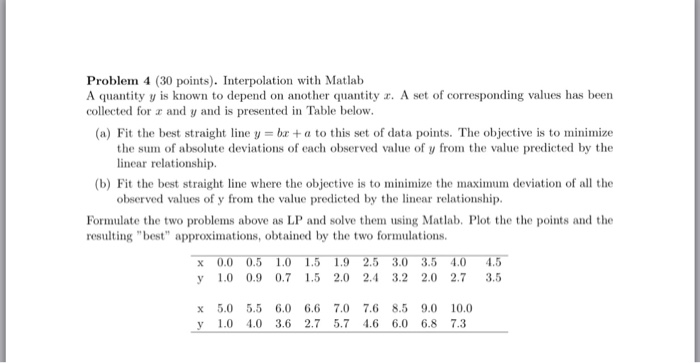
Interpolation with Matlab A quantity y is known to depend on another quantity x. A set of corresponding values has been collected for and y and is presented in Table below. (a) Fit the best straight line y = bx + a to this set of data points. The objective is to minimize the sum of absolute deviations of each observed value of y from the value predicted by the linear relationship. (b) Fit the best straight line where the objective is to minimize the maximum deviation of all the observed values of y from the value predicted by the linear relationship. Formulate the two problems above as LP and solve them using Matlab. Plot the the points and the resulting "best" approximations, obtained by the two formulations
Step by Step Solution
There are 3 Steps involved in it

Get step-by-step solutions from verified subject matter experts