Answered step by step
Verified Expert Solution
Link Copied!

Question

1 Approved Answer

Interpret the bar graph with two variables and answer the question below The Ministry of Economics in Country X records consumer vehicle sales. The ministry

Interpret the bar graph with two variables and answer the question belowimage text in transcribed

The Ministry of Economics in Country X records consumer vehicle sales. The ministry divides these sales into two categories: "Cars" and "SUVs/Light Trucks". You are given the following plot to help visualize car sales through time. Given the plot, which of the following BEST describes how the numb of SUV/light truck sales changed from the beginning to the end of the time period shown? (Here, the bars use the scale on the left-hand side of the graph, and the line uses the scale on the right-hand side of the graph.) Car Sales in Country X Total car sales and cars sales as a percentage of all consumer vehicle sales A. Rose for the first half of the time period, then declined for the second half B. Rose for the entire time period C. Declined for the first half of the time period, then rose for the second half D. Declined for the entire time period E. Chopped around with no trend for the entire time period

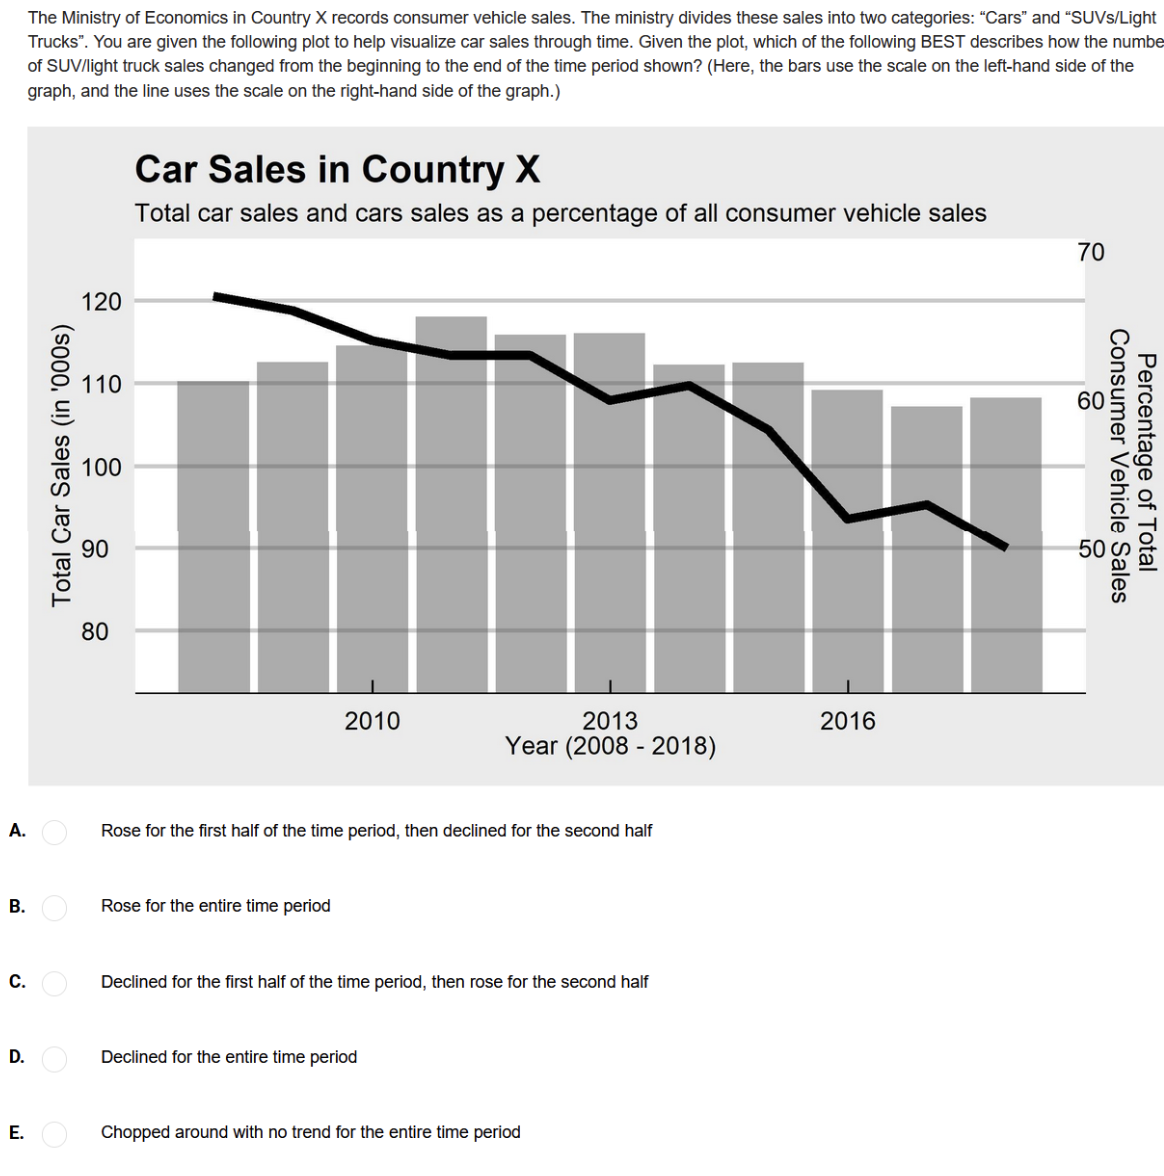
Step by Step Solution

There are 3 Steps involved in it

Step: 1

blur-text-image

Get Instant Access to Expert-Tailored Solutions

See step-by-step solutions with expert insights and AI powered tools for academic success

Step: 2

blur-text-image

Step: 3

blur-text-image

Ace Your Homework with AI

Get the answers you need in no time with our AI-driven, step-by-step assistance

Get Started

Recommended Textbook for

Cpa Financial Services A Guide To Fitting The Pieces Together

Authors: Billy Hemby

1st Edition

1958331007, 978-1958331002

More Books

Students also viewed these Accounting questions