

Answered step by step
Verified Expert Solution
Question
1 Approved Answer
interpret the graph ? 70,000 60,000 Cost per year 50,000 40,000 30,000 20,000 Annual Premium 10,000 Surplus 0 40 45 50 55 60 65 70
interpret the graph ? 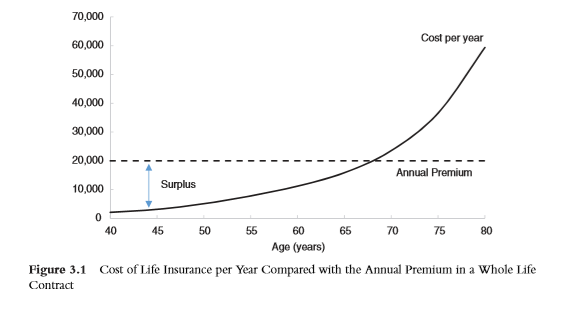
Step by Step Solution
There are 3 Steps involved in it
Step: 1

Get Instant Access to Expert-Tailored Solutions
See step-by-step solutions with expert insights and AI powered tools for academic success
Step: 2

Step: 3
Ace Your Homework with AI
Get the answers you need in no time with our AI-driven, step-by-step assistance
Get Started
Handbook Of Global Financial Markets
Authors: Sabri Boubaker, Duc Khuong Nguyen
1st Edition
9813236647, 978-9813236646