Answered step by step
Verified Expert Solution
Link Copied!

Question

1 Approved Answer

interpret the IR spectrum 100 95 90 1652.67 1264.72 85 1036.41 1136.87 875.97 80 1437.06 1321.40 75 % Transmittance 2836.87 916.137 70 3022.05 65 60

interpret the IR spectrum
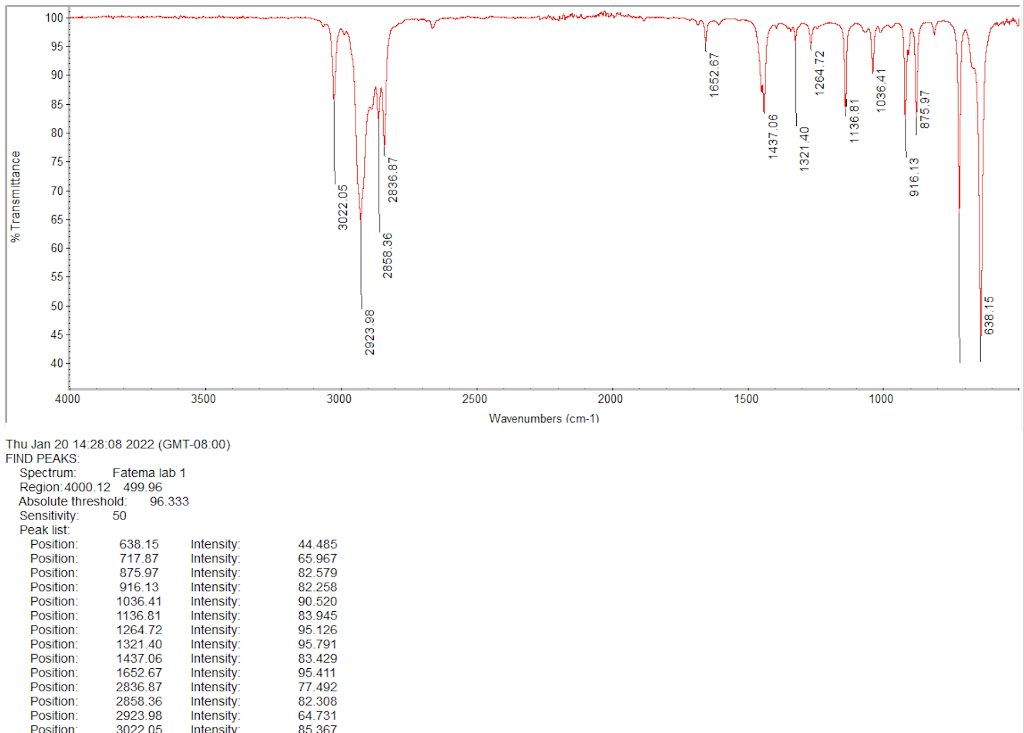
image text in transcribed

100 95 90 1652.67 1264.72 85 1036.41 1136.87 875.97 80 1437.06 1321.40 75 % Transmittance 2836.87 916.137 70 3022.05 65 60 2858.36 55 50 45 2923.98 638.15 40 4000 3500 3000 1500 1000 2500 2000 Wavenumbers (cm-1) ( Thu Jan 20 14 28.08 2022 (GMT-08:00) FIND PEAKS Spectrum Fatema lab 1 Region: 4000.12 499.96 Absolute threshold 96.333 Sensitivity 50 Peak list: Position: 638.15 Intensity Position 717.87 Intensity Position: 875.97 Intensity Position 916.13 Intensity Position 1036.41 Intensity Position: 1136.81 Intensity Position 1264.72 Intensity Position 1321.40 Intensity Position: 1437.06 Intensity Position: 1652.67 Position 2836.87 Intensity Position 2858.36 Intensity Position: 2923.98 Intensity Position 3022 05 Intensity 44.485 65.967 82.579 82.258 90.520 83.945 95.126 95.791 83.429 95.411 77.492 82.308 64.731 85 367 Intensity

Step by Step Solution

There are 3 Steps involved in it

Step: 1

blur-text-image

Get Instant Access to Expert-Tailored Solutions

See step-by-step solutions with expert insights and AI powered tools for academic success

Step: 2

blur-text-image

Step: 3

blur-text-image

Ace Your Homework with AI

Get the answers you need in no time with our AI-driven, step-by-step assistance

Get Started

Recommended Textbook for

Quantitative Chemical Analysis

Authors: Daniel C. Harris, Charles A. Lucy

10th Edition

1319164307, 978-1319164300

More Books

Students also viewed these Chemistry questions