

Question
Interpret whether the trend for each ratio above is an improvement or a decline in performance for the company. Create a table that lists each
Interpret whether the trend for each ratio above is an improvement or a decline in performance for the company.
Create a table that lists each ratio as either a strength or a weakness in the most current year, based on its trend and your interpretation.
Determine the overall financial strength of the company based on the ratios identified as either strengths or weaknesses.
Consider all of the ratios discussed so far. Is the company's strength the fact that the debt management ratios are improving? Or is it that the liquidity ratios are increasing? Is the company's weakness that the turnover ratios are declining? Or is the company's weakness that debt management ratios are weakening?
Categorize the company's overall ratio performance as either strong, neutral, or weak, based on your determination from the ratios.
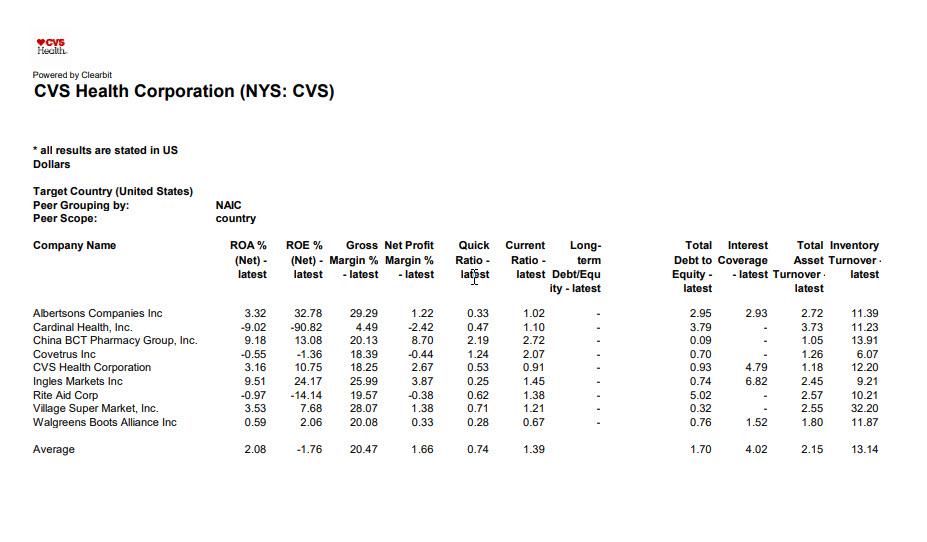
CVS Health Powered by Clearbit CVS Health Corporation (NYS: CVS) * all results are stated in US Dollars Target Country (United States) Peer Grouping by: Peer Scope: NAIC country Company Name ROA % ROE % Gross Net Profit Quick Ratio - (Net) - latest (Net) - Margin% Margin% latest - latest - latest Current Long- Ratio - term latest Debt/Equ ity - latest Total Interest Total Inventory Debt to Coverage Asset Turnover Equity - - latest Turnover. latest latest latest latust 32.78 29.29 0.33 1.02 2.95 2.93 2.72 11.39 3.32 -9.02 9.18 -90.82 13.08 4.49 20.13 1.22 -2.42 8.70 0.47 2.19 1.10 2.72 3.79 0.09 3.73 1.05 Albertsons Companies Inc Cardinal Health, Inc. China BCT Pharmacy Group, Inc. Covetrus Inc CVS Health Corporation Ingles Markets Inc Rite Aid Corp Village Super Market, Inc. Walgreens Boots Alliance Inc 11.23 13.91 6.07 12.20 -0.55 3.16 -1.36 10.75 18.39 18 25 -0.44 2.67 9.51 4.79 6.82 25.99 3.87 1.24 0.53 0.25 0.62 0.71 24.17 -14.14 7.68 2.07 0.91 1.45 1.38 1.21 0.67 0.70 0.93 0.74 5.02 0.32 1.26 1.18 2.45 2.57 2.55 1.80 -0.97 3.53 0.59 19.57 28.07 -0.38 1.38 0.33 9.21 10.21 32.20 2.06 20.08 0.28 0.76 1.52 11.87 Average 2.08 -1.76 20.47 1.66 0.74 1.39 1.70 4.02 2.15 13.14 CVS Health Powered by Clearbit CVS Health Corporation (NYS: CVS) * all results are stated in US Dollars Target Country (United States) Peer Grouping by: Peer Scope: NAIC country Company Name ROA % ROE % Gross Net Profit Quick Ratio - (Net) - latest (Net) - Margin% Margin% latest - latest - latest Current Long- Ratio - term latest Debt/Equ ity - latest Total Interest Total Inventory Debt to Coverage Asset Turnover Equity - - latest Turnover. latest latest latest latust 32.78 29.29 0.33 1.02 2.95 2.93 2.72 11.39 3.32 -9.02 9.18 -90.82 13.08 4.49 20.13 1.22 -2.42 8.70 0.47 2.19 1.10 2.72 3.79 0.09 3.73 1.05 Albertsons Companies Inc Cardinal Health, Inc. China BCT Pharmacy Group, Inc. Covetrus Inc CVS Health Corporation Ingles Markets Inc Rite Aid Corp Village Super Market, Inc. Walgreens Boots Alliance Inc 11.23 13.91 6.07 12.20 -0.55 3.16 -1.36 10.75 18.39 18 25 -0.44 2.67 9.51 4.79 6.82 25.99 3.87 1.24 0.53 0.25 0.62 0.71 24.17 -14.14 7.68 2.07 0.91 1.45 1.38 1.21 0.67 0.70 0.93 0.74 5.02 0.32 1.26 1.18 2.45 2.57 2.55 1.80 -0.97 3.53 0.59 19.57 28.07 -0.38 1.38 0.33 9.21 10.21 32.20 2.06 20.08 0.28 0.76 1.52 11.87 Average 2.08 -1.76 20.47 1.66 0.74 1.39 1.70 4.02 2.15 13.14Step by Step Solution
There are 3 Steps involved in it
Step: 1

Get Instant Access to Expert-Tailored Solutions
See step-by-step solutions with expert insights and AI powered tools for academic success
Step: 2

Step: 3
Ace Your Homework with AI
Get the answers you need in no time with our AI-driven, step-by-step assistance
Get Started
Creative Cash Flow Reporting Uncovering Sustainable Financial Performance
Authors: Charles W. Mulford, Eugene E. Comiskey
1st Edition
0471469181, 978-0471469186