Answered step by step
Verified Expert Solution
Question
1 Approved Answer
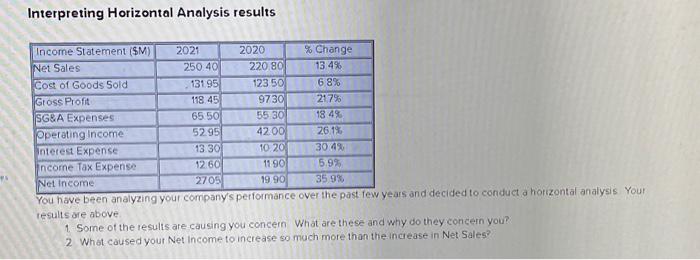
Interpreting Horizontal Analysis results Income Statement ($M) 2021 Net Sales Cost of Goods Sold 2020 % Change 250.40 13.4% 131.95 6.8% 118.45 21,7% 65.50

Interpreting Horizontal Analysis results Income Statement ($M) 2021 Net Sales Cost of Goods Sold 2020 % Change 250.40 13.4% 131.95 6.8% 118.45 21,7% 65.50 18.4% Operating Income 52.95 26.1% Interest Expense 13.30 30.4% Income Tax Expense 12.60 5.9% Net Income 27.05 35.9% You have been analyzing your company's performance over the past few years and decided to conduct a horizontal analysis Your results are above. 1. Some of the results are causing you concern What are these and why do they concern you? 2 What caused your Net Income to increase so much more than the increase in Net Sales? Gross Profit SG&A Expenses 220 80 123 50 9730 55.30 42.00 10 20 1190) 19.90
Step by Step Solution
There are 3 Steps involved in it
Step: 1
The image shows a table with a horizontal analysis of an income statement for the years 2020 and 2021 It presents financial figures in millions of dol...
Get Instant Access to Expert-Tailored Solutions
See step-by-step solutions with expert insights and AI powered tools for academic success
Step: 2

Step: 3

Ace Your Homework with AI
Get the answers you need in no time with our AI-driven, step-by-step assistance
Get Started


