Question
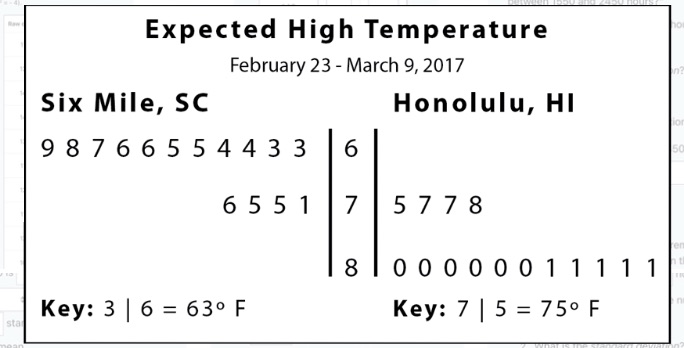
Interpreting the GraphNow that we have a back-to-back stem and leaf chart, we can easily compare that data. We can see the Honolulu is forecast
Interpreting the GraphNow that we have a back-to-back stem and leaf chart, we can easily compare that data. We can see the Honolulu is forecast to have warmer days than Six Mile.* Can you tell which one is more variability? Glancing at the chart, the graphs look pretty similar. Six Mile has eleven days in the 60s and Honolulu has eleven days in the 80s. Six Mile and Honolulu each have _____?days in the 70s.* Now let's look at the range. The range of the temperatures for Six Mile is ____?and the range of the temperatures in Honolulu is 6. Based on the range, which city has more variability on the forecast temperatures? Honolulu or Six Mile?* Let's find the standard deviation of each city. The population standard deviation for the Six Mile temperatures is _____?(round to the nearest hundredth) and the population standard deviation for the Honolulu temperatures is ______?(round to nearest hundredth). Based on the standard deviation, which city has more variability in the forecast temperatures? Honolulu or Six Mile?* Based on the data, which city has more predictable or consistent temperatures for this time period? Honolulu or Six Mile ?

Step by Step Solution
There are 3 Steps involved in it
Step: 1

Get Instant Access to Expert-Tailored Solutions
See step-by-step solutions with expert insights and AI powered tools for academic success
Step: 2

Step: 3

Ace Your Homework with AI
Get the answers you need in no time with our AI-driven, step-by-step assistance
Get Started


