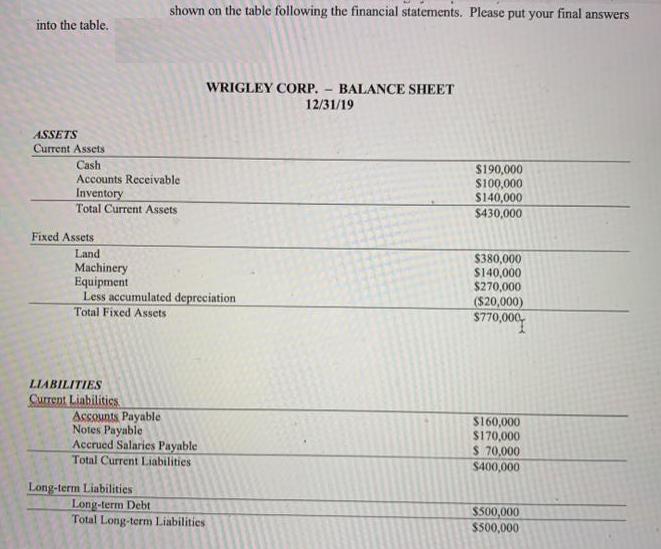
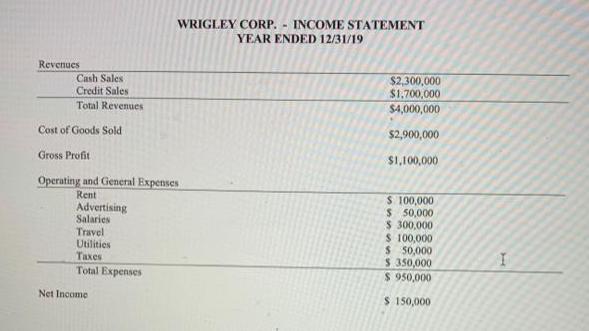
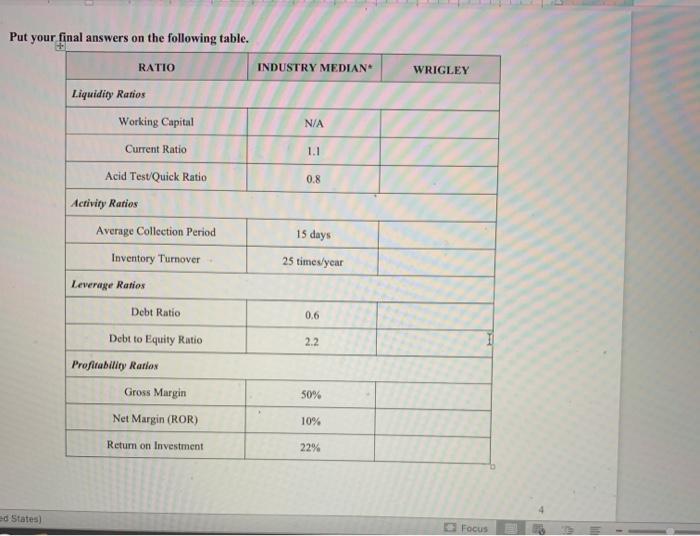
into the table. ASSETS Current Assets Cash Accounts Receivable Inventory Total Current Assets Fixed Assets shown on the table following the financial statements. Please


into the table. ASSETS Current Assets Cash Accounts Receivable Inventory Total Current Assets Fixed Assets shown on the table following the financial statements. Please put your final answers LIABILITIES Current Liabilities Land Machinery Equipment Less accumulated depreciation Total Fixed Assets Accounts Payable Notes Payable Accrued Salaries Payable Total Current Liabilities Long-term Liabilities WRIGLEY CORP. BALANCE SHEET Long-term Debt Total Long-term Liabilities - 12/31/19 $190,000 $100,000 $140,000 $430,000 $380,000 $140,000 $270,000 ($20,000) $770,000 $160,000 $170,000 $ 70,000 $400,000 $500,000 $500,000 Revenues Cash Sales Credit Sales Total Revenues Cost of Goods Sold Gross Profit Operating and General Expenses Rent Advertising Salaries Travel Utilities Taxes Total Expenses WRIGLEY CORP. - INCOME STATEMENT YEAR ENDED 12/31/19 Net Income $2,300,000 $1,700,000 $4,000,000 $2,900,000 $1,100,000 $ 100,000 $ 50,000 $ 300,000 $ 100,000 $ 50,000 $ 350,000 $ 950,000 $ 150,000 I Put your final answers on the following table. + ed States) RATIO Liquidity Ratios Working Capital Current Ratio Acid Test/Quick Ratio Activity Ratios Average Collection Period Inventory Turnover. Leverage Ratios Debt Ratio Debt to Equity Ratio Profitability Ratios Gross Margin Net Margin (ROR) Return on Investment INDUSTRY MEDIAN N/A 1.1 0.8 15 days 25 times/year 0.6 2.2 50% 10% 22% WRIGLEY Focus
Step by Step Solution
3.46 Rating (149 Votes )
There are 3 Steps involved in it
Step: 1
1 2 Liquidity Ratio 3 Working Capital 4 Total Current Assets Total Current Liabilities 5 Current Rat...
See step-by-step solutions with expert insights and AI powered tools for academic success
Step: 2

Step: 3

Ace Your Homework with AI
Get the answers you need in no time with our AI-driven, step-by-step assistance
Get Started


