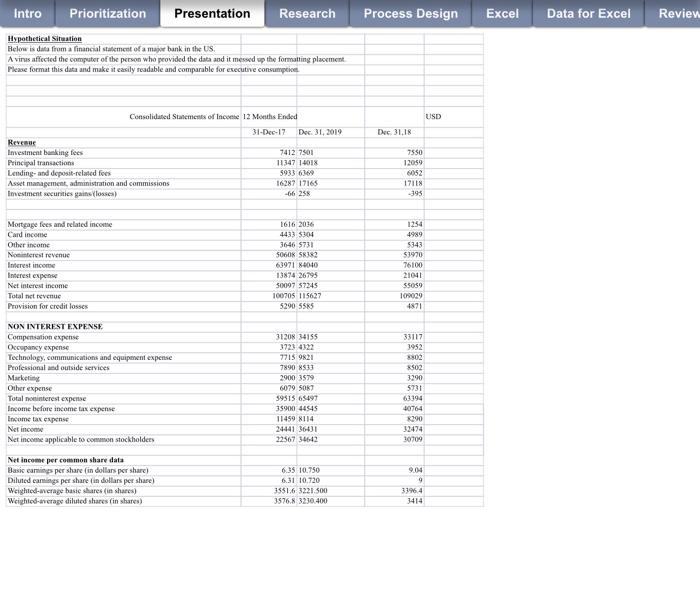
Intro Prioritization Presentation Research Hypothetical Situation Below is data from a financial statement of a major bank in the US. A virus affected the computer of the person who provided the data and it messed up the formatting placement Please format this data and make it easily readable and comparable for executive consumption Consolidated Statements of Income 12 Months Ended 31-Dec-17 Dec. 31, 2019 Revenue Investment banking fees Principal transactions Lending- and deposit-related fees Asset management, administration and commissions Investment securities gains (losses) Mortgage fees and related income Card income Other income Noninterest revenue Interest income Interest expense Net interest income Total net revenue Provision for credit losses NON INTEREST EXPENSE Compensation expense Occupancy expense Technology, communications and equipment expense Professional and outside services Marketing Other expense Total noninterest expense Income before income tax expense Income tax expense Net income Net income applicable to common stockholders Net income per common share data Basic earnings per share (in dollars per share) Diluted earnings per share (in dollars per share) Weighted average basic shares (in shares) Weighted average diluted shares (in shares) 7412 7501 1134714018 5933 6369 16287 17165 -66 258 1616 2036 4433 5304 3646 5731 50608 58382 63971 84040 13874 26795 50097 57245 100705 115627 5290 5585 31208 34155 3723 4322 7715 9821 7890 8533 2900 3579 6079 5087 59515 65497 35900 44545 11459 8114 24441 36431 22567 34642 6.35 10.750 6.31 10.720 3551,6 3221.500 3576.8 3230.400 Process Design USD Dec. 31,18 7550 12059 6052 17118 -395 1254 4989 5343 $3970 76100 21041 55059 109029 4871 33117 3952 8802 8502 3290 5731 63394 40764 8290 32474 30709 9.04 9 3396.4 3414 Excel Data for Excel Review Intro Prioritization Presentation Research Hypothetical Situation Below is data from a financial statement of a major bank in the US. A virus affected the computer of the person who provided the data and it messed up the formatting placement Please format this data and make it easily readable and comparable for executive consumption Consolidated Statements of Income 12 Months Ended 31-Dec-17 Dec. 31, 2019 Revenue Investment banking fees Principal transactions Lending- and deposit-related fees Asset management, administration and commissions Investment securities gains (losses) Mortgage fees and related income Card income Other income Noninterest revenue Interest income Interest expense Net interest income Total net revenue Provision for credit losses NON INTEREST EXPENSE Compensation expense Occupancy expense Technology, communications and equipment expense Professional and outside services Marketing Other expense Total noninterest expense Income before income tax expense Income tax expense Net income Net income applicable to common stockholders Net income per common share data Basic earnings per share (in dollars per share) Diluted earnings per share (in dollars per share) Weighted average basic shares (in shares) Weighted average diluted shares (in shares) 7412 7501 1134714018 5933 6369 16287 17165 -66 258 1616 2036 4433 5304 3646 5731 50608 58382 63971 84040 13874 26795 50097 57245 100705 115627 5290 5585 31208 34155 3723 4322 7715 9821 7890 8533 2900 3579 6079 5087 59515 65497 35900 44545 11459 8114 24441 36431 22567 34642 6.35 10.750 6.31 10.720 3551,6 3221.500 3576.8 3230.400 Process Design USD Dec. 31,18 7550 12059 6052 17118 -395 1254 4989 5343 $3970 76100 21041 55059 109029 4871 33117 3952 8802 8502 3290 5731 63394 40764 8290 32474 30709 9.04 9 3396.4 3414 Excel Data for Excel Review


