

Answered step by step
Verified Expert Solution
Question
1 Approved Answer
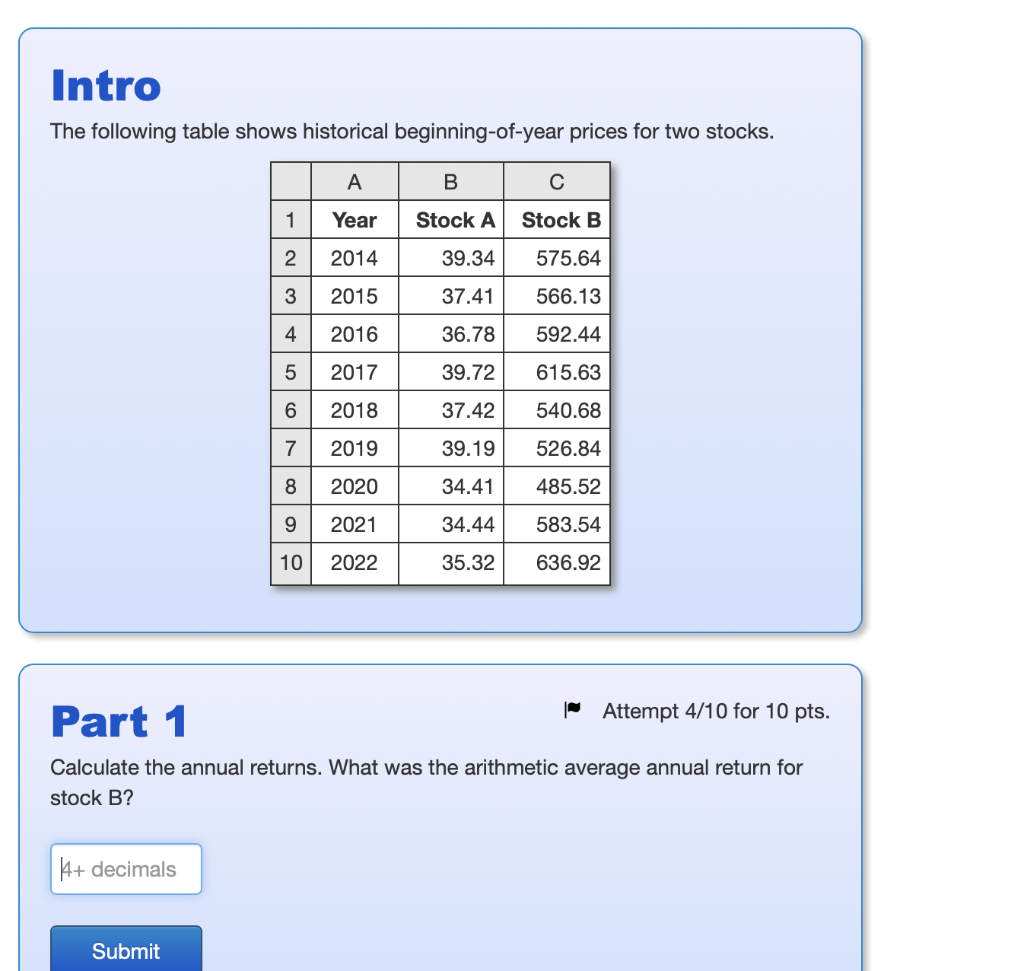
Intro The following table shows historical beginning-of-year prices for two stocks. A Year 2014 2015 2016 2017 2018 2019 2020 2021 2022 4+ decimals 1
Step by Step Solution
There are 3 Steps involved in it
Step: 1

Get Instant Access to Expert-Tailored Solutions
See step-by-step solutions with expert insights and AI powered tools for academic success
Step: 2

Step: 3
Ace Your Homework with AI
Get the answers you need in no time with our AI-driven, step-by-step assistance
Get Started
Return Distributions In Finance
Authors: Stephen Satchell, John Knight
1st Edition
0750647515, 978-0750647519