

Answered step by step
Verified Expert Solution
Question
1 Approved Answer
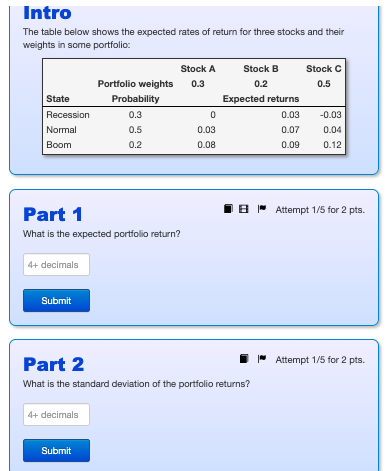
Intro The table below shows the expected rates of return for three stocks and their weights in some portfolio: Stock A 0.3 Stock C 0.5
Step by Step Solution
There are 3 Steps involved in it
Step: 1

Get Instant Access to Expert-Tailored Solutions
See step-by-step solutions with expert insights and AI powered tools for academic success
Step: 2

Step: 3
Ace Your Homework with AI
Get the answers you need in no time with our AI-driven, step-by-step assistance
Get Started
Investments An Introduction
Authors: Herbert B Mayo
9th Edition
324561385, 978-0324561388