

Answered step by step
Verified Expert Solution
Question
1 Approved Answer
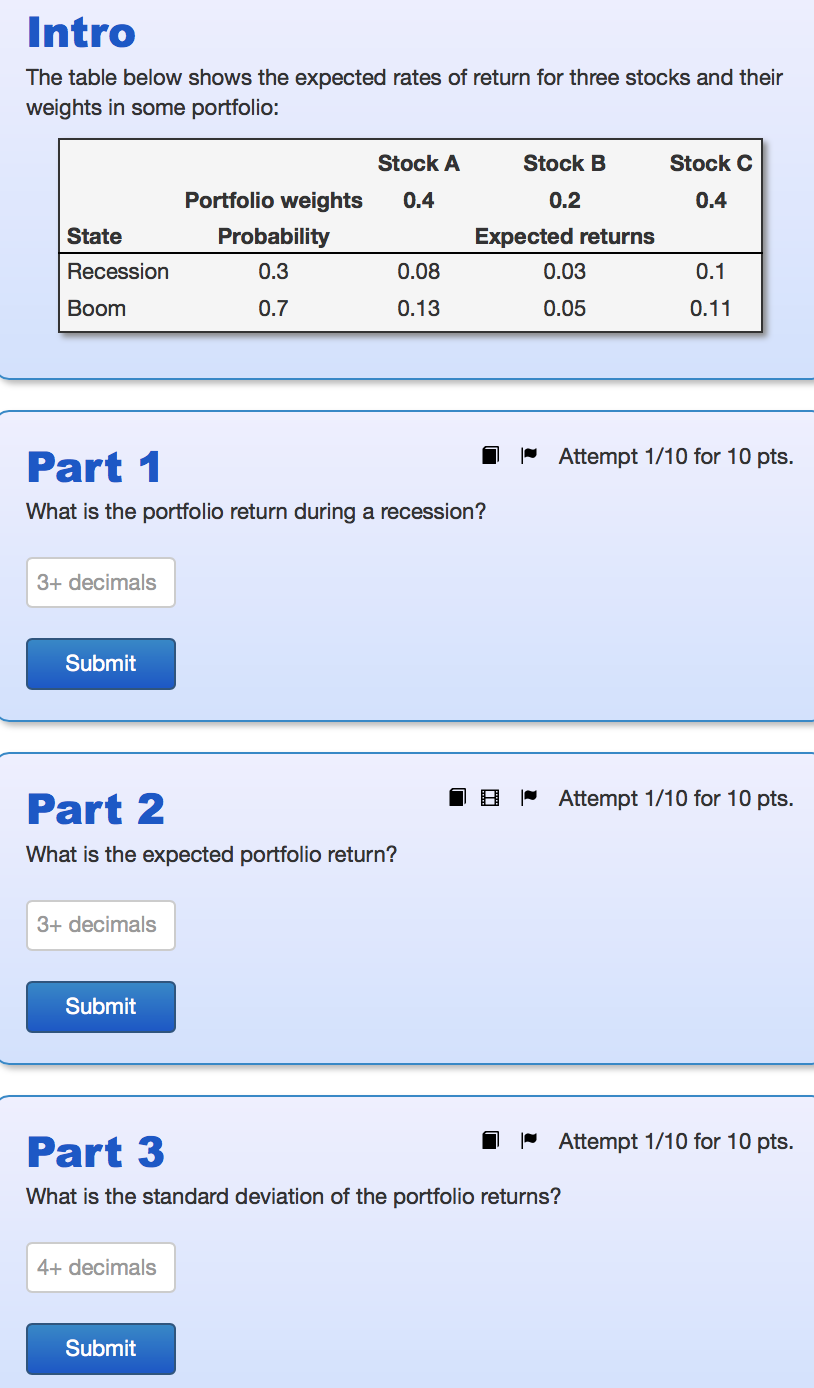
Intro The table below shows the expected rates of return for three stocks and their weights in some portfolio: Stock A Stock B Stock C
Step by Step Solution
There are 3 Steps involved in it
Step: 1

Get Instant Access to Expert-Tailored Solutions
See step-by-step solutions with expert insights and AI powered tools for academic success
Step: 2

Step: 3
Ace Your Homework with AI
Get the answers you need in no time with our AI-driven, step-by-step assistance
Get Started
Multinational Business Finance
Authors: David K. Eiteman, Arthur I. Stonehill, Michael H. Moffett
13th edition
132743469, 978-0132743464