Introduction
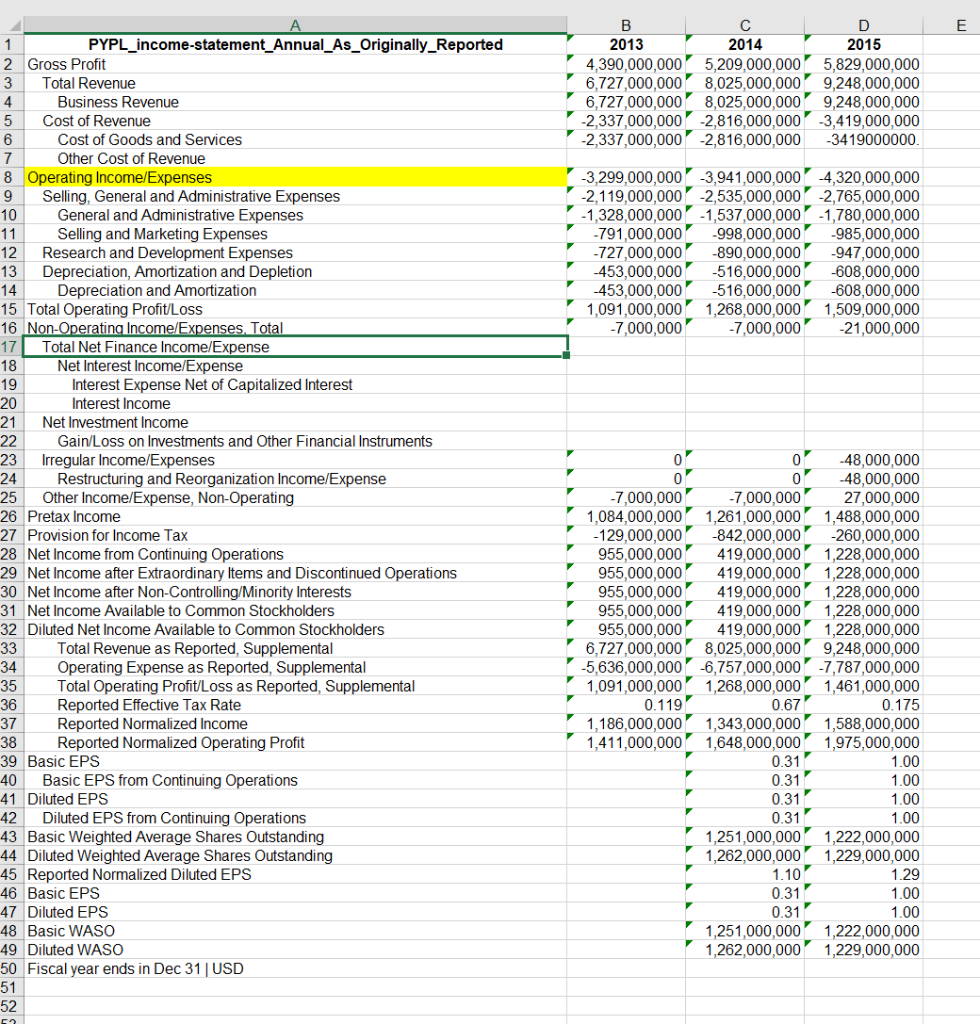
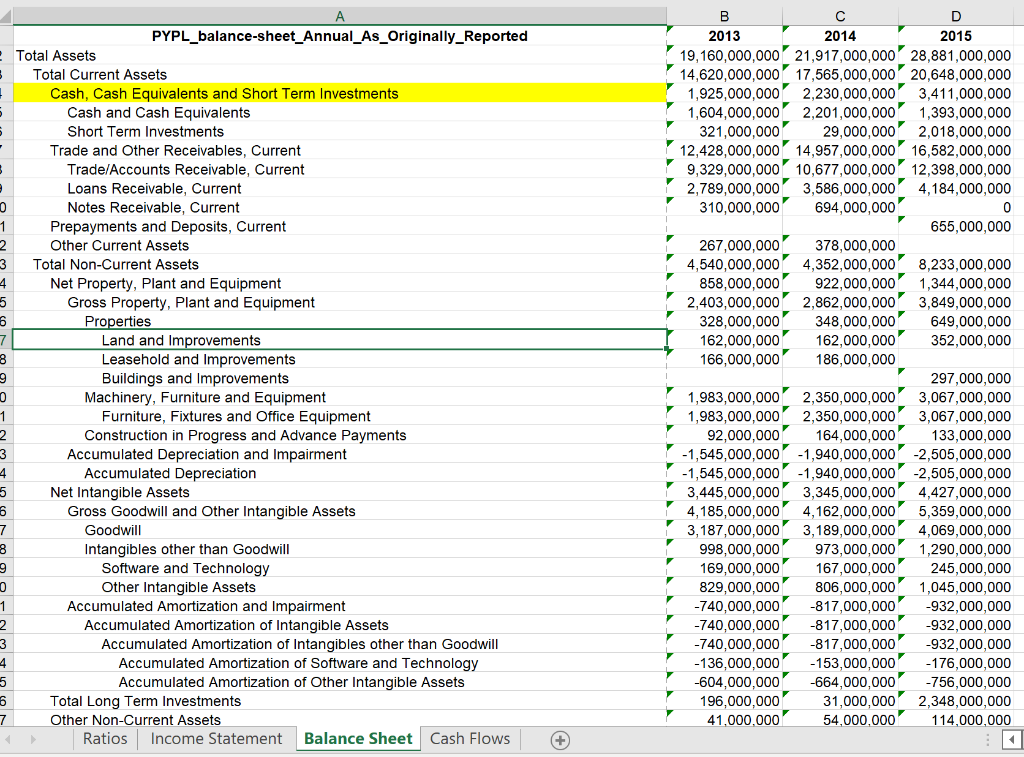
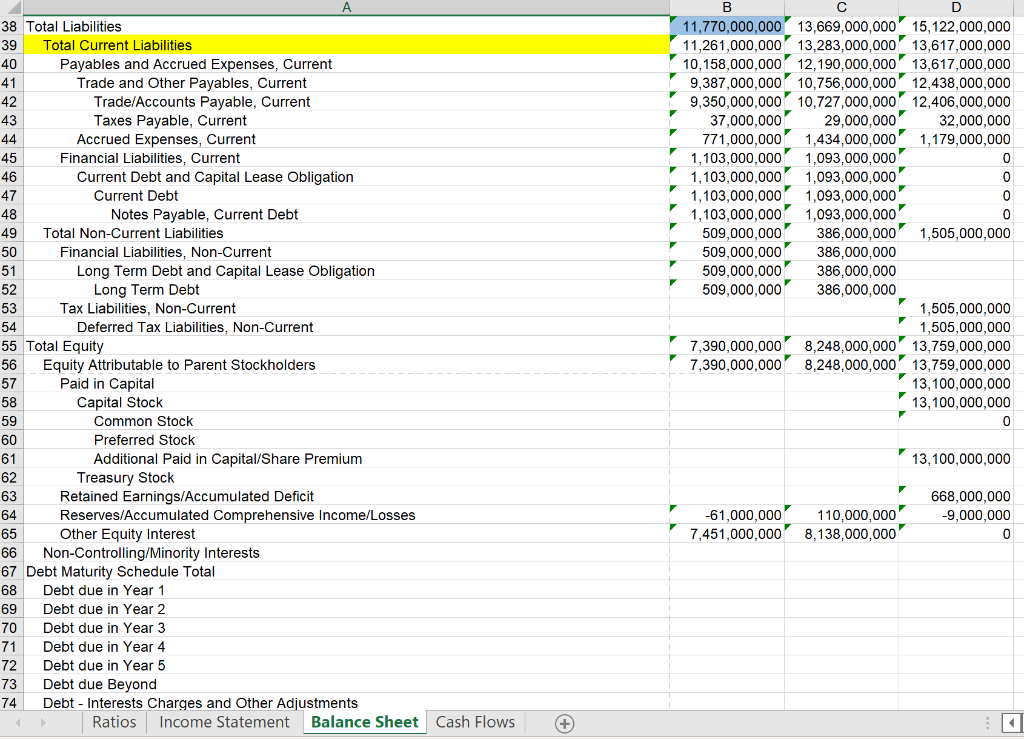
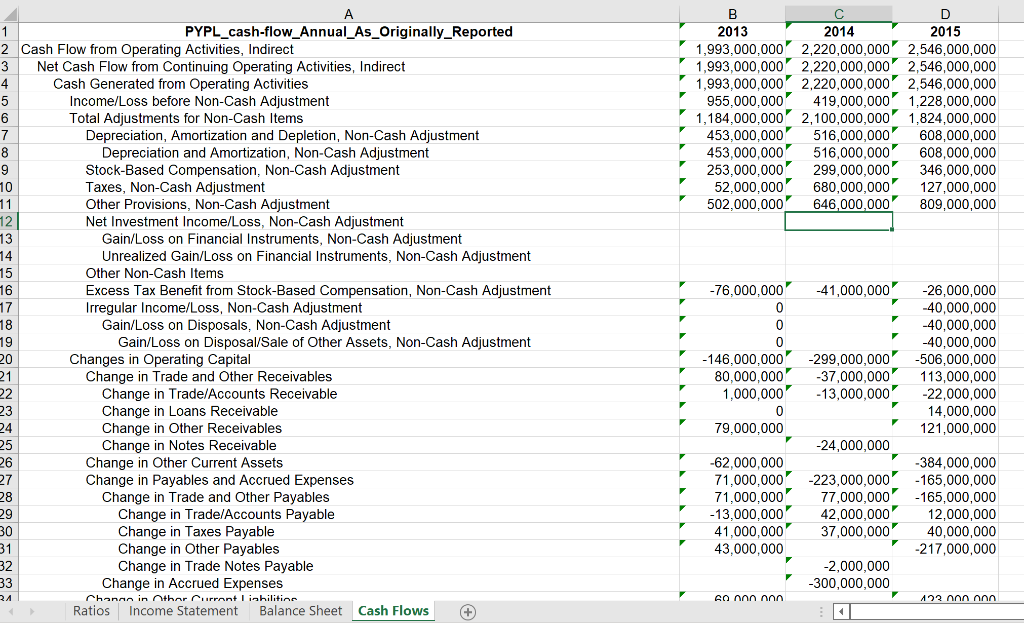
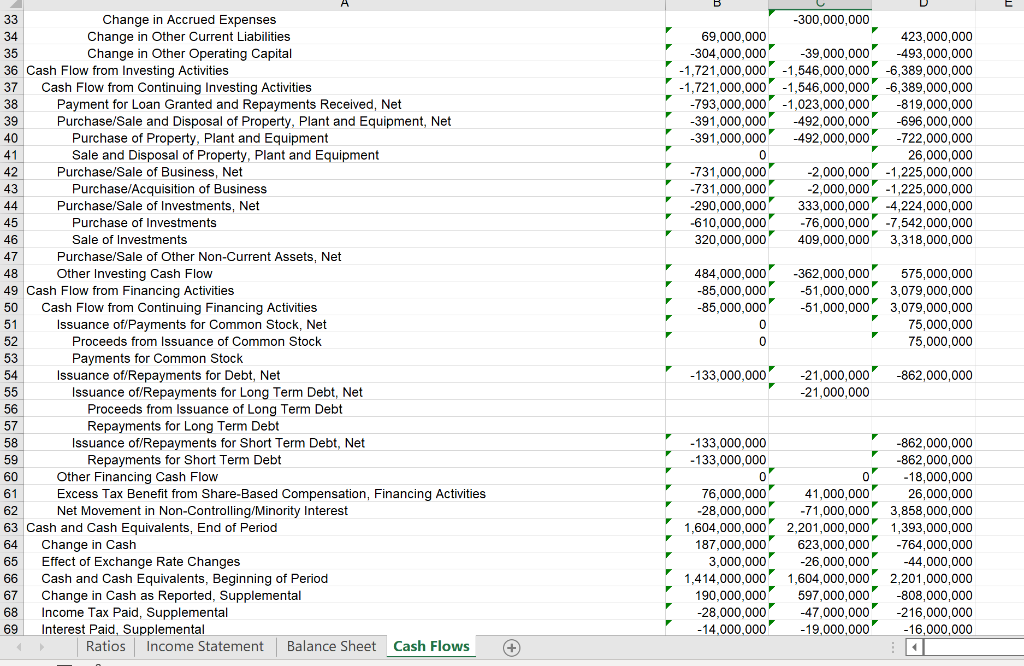
In 2015, PayPal was spun off from eBay and provides electronic payment solutions for both consumers and merchants and maintains a focus on online transactions. For this assignment, you will utilize the attached PayPal Financials MS Excel file to create the major financial ratios. There are four sheets in the PayPal Financials MS Excel file; ratios, income statement, balance sheet, and cash flow. Using this file you will calculate and report the ratio data for PayPal for 2013 2015 and input the data on the first sheet (Ratios).
This is an individual assignment
Directions
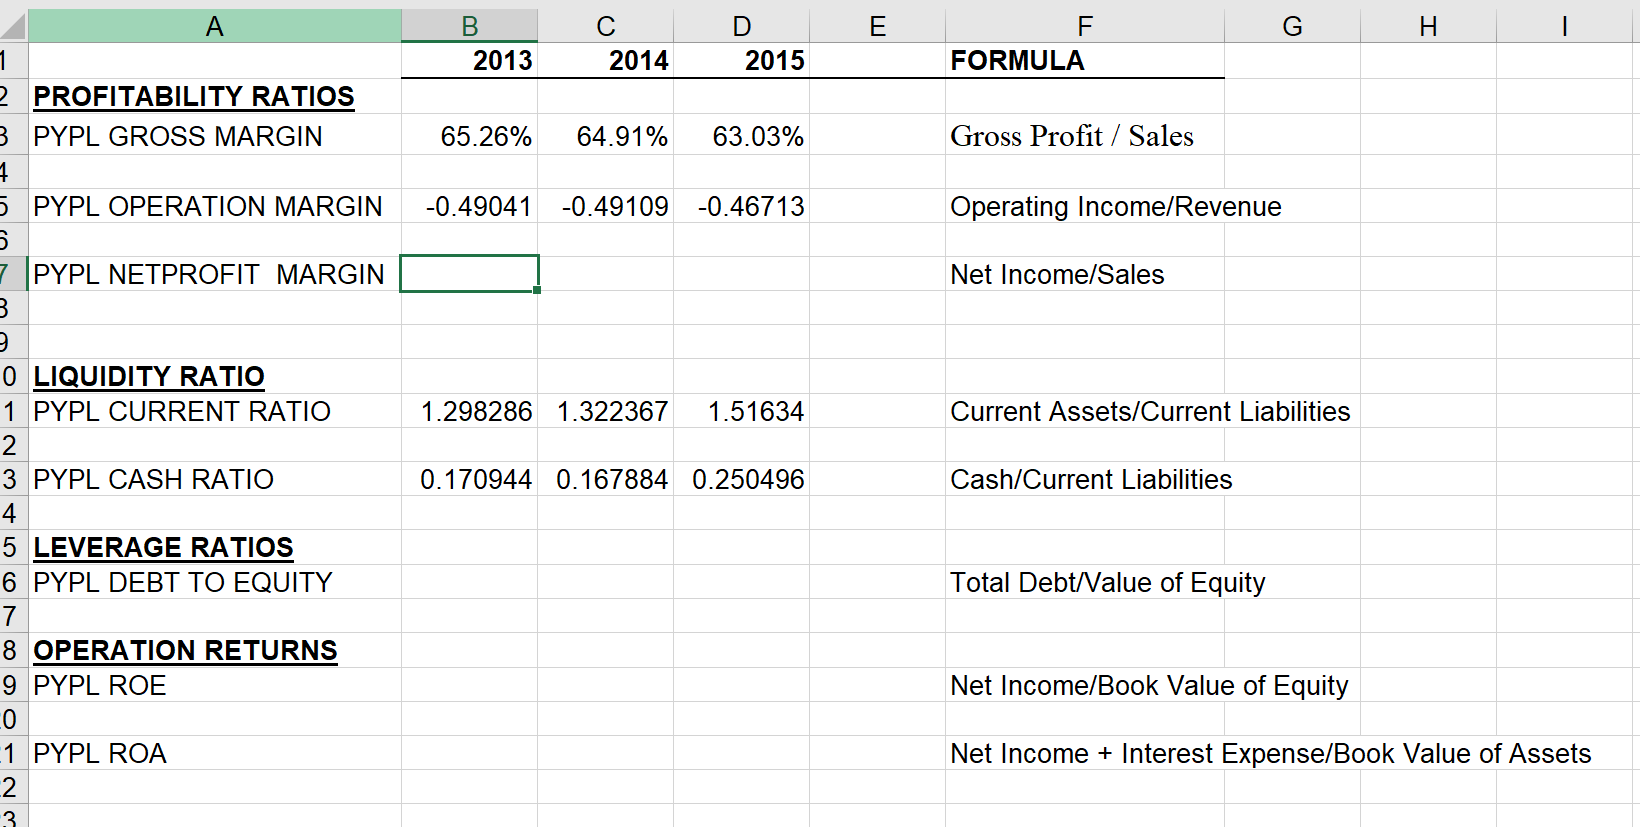
- Place your ratio calculations in the PayPal Financial MS Excel on the Ratios sheet for 2013 -2015.
- Provide the formula used to calculate each ratio in the column to the right of your calculations. For example, for calculating the Gross Margin for a company, you would enter Gross Profit / Sales (gross profit divided by sales).
- When calculating values, you should use the SUM function in MS Excel and reference the values directly from the accounting statements provided. You will find an example for the expectations for calculations and the formulas in the attached file with Gross Margin calculated for 2013 - 2015.
E G I B 2013 2014 D 2015 F FORMULA 65.26% 64.91% 63.03% Gross Profit/ Sales A 1. 2 PROFITABILITY RATIOS 3 PYPL GROSS MARGIN 7 5 PYPL OPERATION MARGIN s 7 PYPL NETPROFIT MARGIN 3 -0.49041 -0.49109 -0.46713 Operating Income/Revenue Net Income/Sales 1.298286 1.322367 1.51634 Current Assets/Current Liabilities 0.170944 0.167884 0.250496 Cash/Current Liabilities 0 LIQUIDITY RATIO 1 PYPL CURRENT RATIO 2 3 PYPL CASH RATIO 4 5 LEVERAGE RATIOS 6 PYPL DEBT TO EQUITY 7 8 OPERATION RETURNS 9 PYPL ROE 0 1 PYPL ROA 2 3 Total Debt/Value of Equity Net Income/Book Value of Equity Net Income + Interest Expense/Book Value of Assets E B D 2013 2014 2015 4,390,000,000 5,209,000,000 5,829,000,000 6,727,000,000 8,025,000,000 9,248,000,000 6,727,000,000 8,025,000,000 9,248,000,000 -2,337,000,000 -2,816,000,000 3,419,000,000 -2,337,000,000 -2,816,000,000 -3419000000 -3,299,000,000 -3,941,000,000 -4,320,000,000 -2,119,000,000 -2,535,000,000 -2,765,000,000 -1,328,000,000 -1,537,000,000 -1,780,000,000 -791,000,000 -998,000,000 -985,000,000 -727,000,000 -890.000.000 -947,000,000 -453,000,000 -516.000.000 -608,000,000 -453,000,000 -516,000,000 -608,000,000 1,091,000,000 1,268,000,000 1,509,000,000 -7,000,000 -7,000,000 -21,000,000 1 PYPL_income-statement_Annual_As_Originally_Reported 2 Gross Profit 3 Total Revenue 4 Business Revenue 5 Cost of Revenue 6 Cost of Goods and Services 7 Other Cost of Revenue 8 Operating Income/Expenses 9 Selling, General and Administrative Expenses 10 General and Administrative Expenses 11 Selling and Marketing Expenses 12 Research and Development Expenses 13 Depreciation, Amortization and Depletion 14 Depreciation and Amortization 15 Total Operating Profit/Loss 16 Non-Operating Income/Expenses. Total 17 Total Net Finance Income/Expense 18 Net Interest Income/Expense 19 Interest Expense Net of Capitalized Interest 20 Interest Income 21 Net Investment Income 22 Gain/Loss on Investments and Other Financial Instruments 23 Irregular Income/Expenses 24 Restructuring and Reorganization Income/Expense 25 Other Income/Expense, Non-Operating 26 Pretax Income 27 Provision for Income Tax 28 Net Income from Continuing Operations 29 Net Income after Extraordinary Items and Discontinued Operations 30 Net Income after Non-Controlling/Minority Interests 31 Net Income Available to Common Stockholders 32 Diluted Net Income Available to Common Stockholders 33 Total Revenue as Reported, Supplemental 34 Operating Expense as Reported, Supplemental 35 Total Operating Profit/Loss as Reported, Supplemental 36 Reported Effective Tax Rate 37 Reported Normalized Income 38 Reported Normalized Operating Profit 39 Basic EPS 40 Basic EPS from Continuing Operations 41 Diluted EPS 42 Diluted EPS from Continuing Operations 43 Basic Weighted Average Shares Outstanding 44 Diluted Weighted Average Shares Outstanding 45 Reported Normalized Diluted EPS 46 Basic EPS 47 Diluted EPS 48 Basic WASO 49 Diluted WASO 50 Fiscal year ends in Dec 31 USD 51 52 01 0 -48,000,000 0 -48,000,000 -7,000,000 -7,000,000 27,000,000 1,084,000,000 1,261,000,000 1,488,000,000 -129,000,000 -842.000.000 -260,000,000 955,000,000 419,000,000 1,228,000,000 955,000,000 419,000,000 1,228,000,000 955,000,000 419,000,000 1,228,000,000 955,000,000 419,000,000 1,228,000,000 955,000,000 419,000,000 1,228,000,000 6,727,000,000 8,025,000,000 9,248,000,000 -5.636,000,000 -6,757,000,000 -7,787,000,000 1,091,000,000 1,268,000,000 1,461,000,000 0.119 0.67 0.175 1,186,000,000 1,343,000,000 1,588,000,000 1,411,000,000 1,648,000,000 1,975,000,000 0.31 1.00 0.317 1.00 0.31 1.00 0.317 1.00 1,251,000,000 1,222,000,000 1,262,000,000 1,229,000,000 1.10 1.29 0.31 1.00 1.00 1,251,000,000 1,222,000,000 1,262,000,000 1,229,000,000 0.31 PYPL_balance-sheet_Annual_As_Originally_Reported Total Assets Total Current Assets Cash, Cash Equivalents and Short Term Investments Cash and Cash Equivalents Short Term Investments Trade and Other Receivables, Current Trade/Accounts Receivable, Current Loans Receivable, Current Notes Receivable, Current 1 Prepayments and Deposits, Current 2 Other Current Assets 3 Total Non-Current Assets 4 Net Property, Plant and Equipment 5 Gross Property, Plant and Equipment 6 Properties 7 Land and Improvements 3 Leasehold and Improvements 9 Buildings and Improvements 0 Machinery, Furniture and Equipment 1 Furniture, Fixtures and Office Equipment 2 Construction in Progress and Advance Payments 3 Accumulated Depreciation and Impairment 4 Accumulated Depreciation 5 Net Intangible Assets 6 Gross Goodwill and Other Intangible Assets 7 Goodwill 8 Intangibles other than Goodwill 9 Software and Technology Other Intangible Assets 1 Accumulated Amortization and Impairment 2 Accumulated Amortization of Intangible Assets 3 Accumulated Amortization of Intangibles other than Goodwill 4 Accumulated Amortization of Software and Technology 5 Accumulated Amortization of Other Intangible Assets 6 Total Long Term Investments 7 Other Non-Current Assets Ratios Income Statement Balance Sheet Cash Flows B D 2013 2014 2015 19,160,000,000 21,917,000,000 28,881,000,000 14,620,000,000' 17,565,000,000 20,648,000,000 1,925,000,000 2,230,000,000 3,411,000,000 1,604,000,000 2,201,000,000 1,393,000,000 321,000,000 29,000,000 2,018,000,000 12,428,000,000 14,957,000,000 16,582,000,000 9,329,000,000 10,677,000,000 12,398,000,000 2,789,000,000 3,586,000,000 4,184,000,000 310,000,000 694,000,000 0 655,000,000 267,000,000 378,000,000 4,540,000,000 4,352,000,000 8,233,000,000 858,000,000 922,000,000 1,344,000,000 2,403,000,000 2,862,000,000 3,849,000,000 328,000,000 348,000,000 649,000,000 162,000,000 162,000,000 352,000,000 166,000,000 186,000,000 297,000,000 1,983,000,000 2,350,000,000 3,067,000,000 1,983,000,000 2,350,000,000 3,067,000,000 92,000,000 164,000,000 133,000,000 -1,545,000,000 -1,940,000,000 -2,505,000,000 -1,545,000,000 -1,940,000,000 -2,505,000,000 3,445,000,000 3,345,000,000' 4,427,000,000 4,185,000,000 4,162,000,000 5,359,000,000 3,187,000,000 3,189,000,000 4,069,000,000 998,000,000 973,000,000 1,290,000,000 169,000,000 167,000,000 245,000,000 829,000,000 806,000,000 1,045,000,000 -740,000,000 -817,000,000 -932,000,000 -740,000,000 -817,000,000 -932,000,000 -740,000,000 -817,000,000 -932,000,000 -136,000,000 -153,000,000 -176,000,000 -604,000,000 -664,000,000 -756,000,000 196,000,000 31,000,000 2,348,000,000 41.000.000 54.000.000 114,000,000 7 38 Total Liabilities 39 Total Current Liabilities 40 Payables and Accrued Expenses, Current 41 Trade and Other Payables, Current 42 Trade/Accounts Payable, Current 43 Taxes Payable, Current 44 Accrued Expenses, Current 45 Financial Liabilities, Current 46 Current Debt and Capital Lease Obligation 47 Current Debt 48 Notes Payable, Current Debt 49 Total Non-Current Liabilities 50 Financial Liabilities, Non-Current 51 Long Term Debt and Capital Lease Obligation 52 Long Term Debt 53 Tax Liabilities, Non-Current 54 Deferred Tax Liabilities, Non-Current 55 Total Equity 56 Equity Attributable to Parent Stockholders 57 Paid in Capital 58 Capital Stock 59 Common Stock 60 Preferred Stock 61 Additional Paid in Capital/Share Premium 62 Treasury Stock 63 Retained Earnings/Accumulated Deficit 64 Reserves/Accumulated Comprehensive Income/Losses 65 Other Equity Interest 66 Non-Controlling/Minority Interests 67 Debt Maturity Schedule Total 68 Debt due in Year 1 69 Debt due in Year 2 70 Debt due in Year 3 71 Debt due in Year 4 72 Debt due in Year 5 73 Debt due Beyond 74 Debt - Interests Charges and Other Adjustments Ratios Income Statement Balance Sheet Cash Flows B D 11,770,000,000 13,669,000,000 15,122,000,000 11,261,000,000 13,283,000,000 13,617,000,000 10,158,000,000 12,190,000,000 13,617,000,000 9,387,000,000 10,756,000,000 12,438,000,000 9,350,000,000 10,727,000,000 12,406,000,000 37,000,000 29,000,000 32,000,000 771,000,000 1,434,000,000 1,179,000,000 1,103,000,000 1,093,000,000 0 1,103,000,000 1,093,000,000 0 1,103,000,000 1,093,000,000 0 1,103,000,000 1,093,000,000 0 509,000,000 386,000,000 1,505,000,000 509,000,000 386,000,000 509,000,000 386,000,000 509,000,000 386,000,000 1,505,000,000 1,505,000,000 7,390,000,000 8,248,000,000 13,759,000,000 7 7,390,000,000 8,248,000,000 13,759,000,000 13,100,000,000 13,100,000,000 0 13,100,000,000 -61,000,000 7,451,000,000 110,000,000 8,138,000,000 668,000,000 -9,000,000 0 + B D 2013 2014 2015 1,993,000,000 2,220,000,000' 2,546,000,000 1,993,000,000 2,220,000,000 2,546,000,000 1,993,000,000 2,220,000,000 2,546,000,000 955,000,000 419,000,000 1,228,000,000 1,184,000,000 2,100,000,000 1,824,000,000 453,000,000 516,000,000 608,000,000 453,000,000 516,000,000 608,000,000 253,000,000 299,000,000 346,000,000 52,000,000 680,000,000 127,000,000 502,000,000 646,000,000 809,000,000 -41,000,000 1 PYPL_cash-flow_Annual_As_Originally_Reported 2 Cash Flow from Operating Activities, Indirect 3 Net Cash Flow from Continuing Operating Activities, Indirect 4 Cash Generated from Operating Activities 5 Income/Loss before Non-Cash Adjustment 6 Total Adjustments for Non-Cash Items 7 Depreciation, Amortization and Depletion, Non-Cash Adjustment 8 Depreciation and Amortization, Non-Cash Adjustment 9 Stock-Based Compensation, Non-Cash Adjustment 10 Taxes, Non-Cash Adjustment 11 Other Provisions, Non-Cash Adjustment 12| Net Investment Income/Loss, Non-Cash Adjustment 13 Gain/Loss on Financial Instruments, Non-Cash Adjustment 14 Unrealized Gain/Loss on Financial Instruments, Non-Cash Adjustment 15 Other Non-Cash Items 16 Excess Tax Benefit from Stock-Based Compensation, Non-Cash Adjustment 17 Irregular Income/Loss, Non-Cash Adjustment 18 Gain/Loss on Disposals, Non-Cash Adjustment 19 Gain/Loss on Disposal/Sale of Other Assets, Non-Cash Adjustment 20 Changes in Operating Capital 21 Change in Trade and Other Receivables 22 Change in Trade/Accounts Receivable 23 Change in Loans Receivable 24 Change in Other Receivables 25 Change in Notes Receivable 26 Change in Other Current Asset 27 Change in Payables and Accrued Expenses 28 Change in Trade and Other Payables 29 Change in Trade/Accounts Payable 30 Change in Taxes Payable 31 Change in Other Payables 32 Change in Trade Notes Payable 33 Change in Accrued Expenses Channn in thar Currant lichilitinn Ratios Income Statement Balance Sheet Cash Flows -76,000,000 0 0 0 -146,000,000 80,000,000 1,000,000 0 79,000,000 -299,000,000 -37,000,000 -13,000,000 -26,000,000 -40,000,000 -40,000,000 -40,000,000 -506,000,000 113,000,000 -22,000,000 14,000,000 121,000,000 -24,000,000 -62 ,000 71,000,000 71,000,000 - 13,000,000 41,000,000 43,000,000 -223,000,000 77,000,000 42,000,000 37,000,000 -384,00 - 165,000,000 -165,000,000 12,000,000 40,000,000 -217,000,000 -2,000,000 -300,000,000 24 60 on onn 122 nnnnnn -300,000,000 69,000,000 423,000,000 -304,000,000 -39,000,000 -493,000,000 -1,721,000,000 -1,546,000,000 -6,389,000,000 -1,721,000,000 -1,546,000,000 -6,389,000,000 -793,000,000 -1,023,000,000 -819,000,000 -391,000,000 -492,000,000 -696,000,000 -391,000,000 -492,000,000 -722,000,000 0 26,000,000 -731,000,000 -2,000,000 -1,225,000,000 -731,000,000 -2,000,000 -1,225,000,000 -290,000,000 333,000,000 -4,224,000,000 -610,000,000 -76,000,000 -7,542,000,000 320,000,000 409,000,000 3,318,000,000 33 Change in Accrued Expenses 34 Change in Other Current Liabilities 35 Change in Other Operating Capital 36 Cash Flow from Investing Activities 37 Cash Flow from Continuing Investing Activities 38 Payment for Loan Granted and Repayments Received, Net 39 Purchase/Sale and Disposal of Property, Plant and Equipment, Net 40 Purchase of Property, Plant and Equipment 41 Sale and Disposal of Property, Plant and Equipment 42 Purchase/Sale of Business, Net 43 Purchase/Acquisition of Business 44 Purchase/Sale of Investments, Net 45 Purchase of Investments 46 Sale of Investments 47 Purchase/Sale of Other Non-Current Assets, Net 48 Other Investing Cash Flow 49 Cash Flow from Financing Activities 50 Cash Flow from Continuing Financing Activities 51 Issuance of/Payments for Common Stock, Net 52 Proceeds from Issuance of Common Stock 53 Payments for Common Stock 54 Issuance of/Repayments for Debt, Net 55 Issuance of/Repayments for Long Term Debt, Net 56 Proceeds from Issuance of Long Term Debt 57 Repayments for Long Term Debt 58 Issuance of/Repayments for Short Term Debt, Net 59 Repayments for Short Term Debt 60 Other Financing Cash Flow 61 Excess Tax Benefit from Share-Based Compensation, Financing Activities 62 Net Movement in Non-Controlling/Minority Interest 63 Cash and Cash Equivalents, End of Period 64 Change in Cash 65 Effect of Exchange Rate Changes 66 Cash and Cash Equivalents, Beginning of Period 67 Change in Cash as Reported, Supplemental 68 Income Tax Paid, Supplemental 69 Interest Paid, Supplemental Ratios Income Statement Balance Sheet Cash Flows 484,000,000 -85,000,000 -85,000,000 0 0 -362,000,000 575,000,000 -51,000,000 3,079,000,000 -51,000,000 3,079,000,000 75,000,000 75,000,000 -133,000,000 -862,000,000 -21.000.000 -21,000,000 -133,000,000 -133,000,000 0 76.000.000 -28,000,000 1,604,000,000 187.000.000 3,000,000 1,414,000,000 190.000.000 -28,000,000 - 14,000,000 -862,000,000 -862,000,000 0 -18,000,000 41,000,000 26,000,000 -71,000,000 3,858,000,000 2,201,000,000 1,393,000,000 623,000,000 -764,000,000 -26,000,000 -44,000,000 1,604,000,000 2,201,000,000 597,000,000 -808,000,000 -47,000,000 -216,000,000 - 19,000,000 - 16,000,000 + E G I B 2013 2014 D 2015 F FORMULA 65.26% 64.91% 63.03% Gross Profit/ Sales A 1. 2 PROFITABILITY RATIOS 3 PYPL GROSS MARGIN 7 5 PYPL OPERATION MARGIN s 7 PYPL NETPROFIT MARGIN 3 -0.49041 -0.49109 -0.46713 Operating Income/Revenue Net Income/Sales 1.298286 1.322367 1.51634 Current Assets/Current Liabilities 0.170944 0.167884 0.250496 Cash/Current Liabilities 0 LIQUIDITY RATIO 1 PYPL CURRENT RATIO 2 3 PYPL CASH RATIO 4 5 LEVERAGE RATIOS 6 PYPL DEBT TO EQUITY 7 8 OPERATION RETURNS 9 PYPL ROE 0 1 PYPL ROA 2 3 Total Debt/Value of Equity Net Income/Book Value of Equity Net Income + Interest Expense/Book Value of Assets E B D 2013 2014 2015 4,390,000,000 5,209,000,000 5,829,000,000 6,727,000,000 8,025,000,000 9,248,000,000 6,727,000,000 8,025,000,000 9,248,000,000 -2,337,000,000 -2,816,000,000 3,419,000,000 -2,337,000,000 -2,816,000,000 -3419000000 -3,299,000,000 -3,941,000,000 -4,320,000,000 -2,119,000,000 -2,535,000,000 -2,765,000,000 -1,328,000,000 -1,537,000,000 -1,780,000,000 -791,000,000 -998,000,000 -985,000,000 -727,000,000 -890.000.000 -947,000,000 -453,000,000 -516.000.000 -608,000,000 -453,000,000 -516,000,000 -608,000,000 1,091,000,000 1,268,000,000 1,509,000,000 -7,000,000 -7,000,000 -21,000,000 1 PYPL_income-statement_Annual_As_Originally_Reported 2 Gross Profit 3 Total Revenue 4 Business Revenue 5 Cost of Revenue 6 Cost of Goods and Services 7 Other Cost of Revenue 8 Operating Income/Expenses 9 Selling, General and Administrative Expenses 10 General and Administrative Expenses 11 Selling and Marketing Expenses 12 Research and Development Expenses 13 Depreciation, Amortization and Depletion 14 Depreciation and Amortization 15 Total Operating Profit/Loss 16 Non-Operating Income/Expenses. Total 17 Total Net Finance Income/Expense 18 Net Interest Income/Expense 19 Interest Expense Net of Capitalized Interest 20 Interest Income 21 Net Investment Income 22 Gain/Loss on Investments and Other Financial Instruments 23 Irregular Income/Expenses 24 Restructuring and Reorganization Income/Expense 25 Other Income/Expense, Non-Operating 26 Pretax Income 27 Provision for Income Tax 28 Net Income from Continuing Operations 29 Net Income after Extraordinary Items and Discontinued Operations 30 Net Income after Non-Controlling/Minority Interests 31 Net Income Available to Common Stockholders 32 Diluted Net Income Available to Common Stockholders 33 Total Revenue as Reported, Supplemental 34 Operating Expense as Reported, Supplemental 35 Total Operating Profit/Loss as Reported, Supplemental 36 Reported Effective Tax Rate 37 Reported Normalized Income 38 Reported Normalized Operating Profit 39 Basic EPS 40 Basic EPS from Continuing Operations 41 Diluted EPS 42 Diluted EPS from Continuing Operations 43 Basic Weighted Average Shares Outstanding 44 Diluted Weighted Average Shares Outstanding 45 Reported Normalized Diluted EPS 46 Basic EPS 47 Diluted EPS 48 Basic WASO 49 Diluted WASO 50 Fiscal year ends in Dec 31 USD 51 52 01 0 -48,000,000 0 -48,000,000 -7,000,000 -7,000,000 27,000,000 1,084,000,000 1,261,000,000 1,488,000,000 -129,000,000 -842.000.000 -260,000,000 955,000,000 419,000,000 1,228,000,000 955,000,000 419,000,000 1,228,000,000 955,000,000 419,000,000 1,228,000,000 955,000,000 419,000,000 1,228,000,000 955,000,000 419,000,000 1,228,000,000 6,727,000,000 8,025,000,000 9,248,000,000 -5.636,000,000 -6,757,000,000 -7,787,000,000 1,091,000,000 1,268,000,000 1,461,000,000 0.119 0.67 0.175 1,186,000,000 1,343,000,000 1,588,000,000 1,411,000,000 1,648,000,000 1,975,000,000 0.31 1.00 0.317 1.00 0.31 1.00 0.317 1.00 1,251,000,000 1,222,000,000 1,262,000,000 1,229,000,000 1.10 1.29 0.31 1.00 1.00 1,251,000,000 1,222,000,000 1,262,000,000 1,229,000,000 0.31 PYPL_balance-sheet_Annual_As_Originally_Reported Total Assets Total Current Assets Cash, Cash Equivalents and Short Term Investments Cash and Cash Equivalents Short Term Investments Trade and Other Receivables, Current Trade/Accounts Receivable, Current Loans Receivable, Current Notes Receivable, Current 1 Prepayments and Deposits, Current 2 Other Current Assets 3 Total Non-Current Assets 4 Net Property, Plant and Equipment 5 Gross Property, Plant and Equipment 6 Properties 7 Land and Improvements 3 Leasehold and Improvements 9 Buildings and Improvements 0 Machinery, Furniture and Equipment 1 Furniture, Fixtures and Office Equipment 2 Construction in Progress and Advance Payments 3 Accumulated Depreciation and Impairment 4 Accumulated Depreciation 5 Net Intangible Assets 6 Gross Goodwill and Other Intangible Assets 7 Goodwill 8 Intangibles other than Goodwill 9 Software and Technology Other Intangible Assets 1 Accumulated Amortization and Impairment 2 Accumulated Amortization of Intangible Assets 3 Accumulated Amortization of Intangibles other than Goodwill 4 Accumulated Amortization of Software and Technology 5 Accumulated Amortization of Other Intangible Assets 6 Total Long Term Investments 7 Other Non-Current Assets Ratios Income Statement Balance Sheet Cash Flows B D 2013 2014 2015 19,160,000,000 21,917,000,000 28,881,000,000 14,620,000,000' 17,565,000,000 20,648,000,000 1,925,000,000 2,230,000,000 3,411,000,000 1,604,000,000 2,201,000,000 1,393,000,000 321,000,000 29,000,000 2,018,000,000 12,428,000,000 14,957,000,000 16,582,000,000 9,329,000,000 10,677,000,000 12,398,000,000 2,789,000,000 3,586,000,000 4,184,000,000 310,000,000 694,000,000 0 655,000,000 267,000,000 378,000,000 4,540,000,000 4,352,000,000 8,233,000,000 858,000,000 922,000,000 1,344,000,000 2,403,000,000 2,862,000,000 3,849,000,000 328,000,000 348,000,000 649,000,000 162,000,000 162,000,000 352,000,000 166,000,000 186,000,000 297,000,000 1,983,000,000 2,350,000,000 3,067,000,000 1,983,000,000 2,350,000,000 3,067,000,000 92,000,000 164,000,000 133,000,000 -1,545,000,000 -1,940,000,000 -2,505,000,000 -1,545,000,000 -1,940,000,000 -2,505,000,000 3,445,000,000 3,345,000,000' 4,427,000,000 4,185,000,000 4,162,000,000 5,359,000,000 3,187,000,000 3,189,000,000 4,069,000,000 998,000,000 973,000,000 1,290,000,000 169,000,000 167,000,000 245,000,000 829,000,000 806,000,000 1,045,000,000 -740,000,000 -817,000,000 -932,000,000 -740,000,000 -817,000,000 -932,000,000 -740,000,000 -817,000,000 -932,000,000 -136,000,000 -153,000,000 -176,000,000 -604,000,000 -664,000,000 -756,000,000 196,000,000 31,000,000 2,348,000,000 41.000.000 54.000.000 114,000,000 7 38 Total Liabilities 39 Total Current Liabilities 40 Payables and Accrued Expenses, Current 41 Trade and Other Payables, Current 42 Trade/Accounts Payable, Current 43 Taxes Payable, Current 44 Accrued Expenses, Current 45 Financial Liabilities, Current 46 Current Debt and Capital Lease Obligation 47 Current Debt 48 Notes Payable, Current Debt 49 Total Non-Current Liabilities 50 Financial Liabilities, Non-Current 51 Long Term Debt and Capital Lease Obligation 52 Long Term Debt 53 Tax Liabilities, Non-Current 54 Deferred Tax Liabilities, Non-Current 55 Total Equity 56 Equity Attributable to Parent Stockholders 57 Paid in Capital 58 Capital Stock 59 Common Stock 60 Preferred Stock 61 Additional Paid in Capital/Share Premium 62 Treasury Stock 63 Retained Earnings/Accumulated Deficit 64 Reserves/Accumulated Comprehensive Income/Losses 65 Other Equity Interest 66 Non-Controlling/Minority Interests 67 Debt Maturity Schedule Total 68 Debt due in Year 1 69 Debt due in Year 2 70 Debt due in Year 3 71 Debt due in Year 4 72 Debt due in Year 5 73 Debt due Beyond 74 Debt - Interests Charges and Other Adjustments Ratios Income Statement Balance Sheet Cash Flows B D 11,770,000,000 13,669,000,000 15,122,000,000 11,261,000,000 13,283,000,000 13,617,000,000 10,158,000,000 12,190,000,000 13,617,000,000 9,387,000,000 10,756,000,000 12,438,000,000 9,350,000,000 10,727,000,000 12,406,000,000 37,000,000 29,000,000 32,000,000 771,000,000 1,434,000,000 1,179,000,000 1,103,000,000 1,093,000,000 0 1,103,000,000 1,093,000,000 0 1,103,000,000 1,093,000,000 0 1,103,000,000 1,093,000,000 0 509,000,000 386,000,000 1,505,000,000 509,000,000 386,000,000 509,000,000 386,000,000 509,000,000 386,000,000 1,505,000,000 1,505,000,000 7,390,000,000 8,248,000,000 13,759,000,000 7 7,390,000,000 8,248,000,000 13,759,000,000 13,100,000,000 13,100,000,000 0 13,100,000,000 -61,000,000 7,451,000,000 110,000,000 8,138,000,000 668,000,000 -9,000,000 0 + B D 2013 2014 2015 1,993,000,000 2,220,000,000' 2,546,000,000 1,993,000,000 2,220,000,000 2,546,000,000 1,993,000,000 2,220,000,000 2,546,000,000 955,000,000 419,000,000 1,228,000,000 1,184,000,000 2,100,000,000 1,824,000,000 453,000,000 516,000,000 608,000,000 453,000,000 516,000,000 608,000,000 253,000,000 299,000,000 346,000,000 52,000,000 680,000,000 127,000,000 502,000,000 646,000,000 809,000,000 -41,000,000 1 PYPL_cash-flow_Annual_As_Originally_Reported 2 Cash Flow from Operating Activities, Indirect 3 Net Cash Flow from Continuing Operating Activities, Indirect 4 Cash Generated from Operating Activities 5 Income/Loss before Non-Cash Adjustment 6 Total Adjustments for Non-Cash Items 7 Depreciation, Amortization and Depletion, Non-Cash Adjustment 8 Depreciation and Amortization, Non-Cash Adjustment 9 Stock-Based Compensation, Non-Cash Adjustment 10 Taxes, Non-Cash Adjustment 11 Other Provisions, Non-Cash Adjustment 12| Net Investment Income/Loss, Non-Cash Adjustment 13 Gain/Loss on Financial Instruments, Non-Cash Adjustment 14 Unrealized Gain/Loss on Financial Instruments, Non-Cash Adjustment 15 Other Non-Cash Items 16 Excess Tax Benefit from Stock-Based Compensation, Non-Cash Adjustment 17 Irregular Income/Loss, Non-Cash Adjustment 18 Gain/Loss on Disposals, Non-Cash Adjustment 19 Gain/Loss on Disposal/Sale of Other Assets, Non-Cash Adjustment 20 Changes in Operating Capital 21 Change in Trade and Other Receivables 22 Change in Trade/Accounts Receivable 23 Change in Loans Receivable 24 Change in Other Receivables 25 Change in Notes Receivable 26 Change in Other Current Asset 27 Change in Payables and Accrued Expenses 28 Change in Trade and Other Payables 29 Change in Trade/Accounts Payable 30 Change in Taxes Payable 31 Change in Other Payables 32 Change in Trade Notes Payable 33 Change in Accrued Expenses Channn in thar Currant lichilitinn Ratios Income Statement Balance Sheet Cash Flows -76,000,000 0 0 0 -146,000,000 80,000,000 1,000,000 0 79,000,000 -299,000,000 -37,000,000 -13,000,000 -26,000,000 -40,000,000 -40,000,000 -40,000,000 -506,000,000 113,000,000 -22,000,000 14,000,000 121,000,000 -24,000,000 -62 ,000 71,000,000 71,000,000 - 13,000,000 41,000,000 43,000,000 -223,000,000 77,000,000 42,000,000 37,000,000 -384,00 - 165,000,000 -165,000,000 12,000,000 40,000,000 -217,000,000 -2,000,000 -300,000,000 24 60 on onn 122 nnnnnn -300,000,000 69,000,000 423,000,000 -304,000,000 -39,000,000 -493,000,000 -1,721,000,000 -1,546,000,000 -6,389,000,000 -1,721,000,000 -1,546,000,000 -6,389,000,000 -793,000,000 -1,023,000,000 -819,000,000 -391,000,000 -492,000,000 -696,000,000 -391,000,000 -492,000,000 -722,000,000 0 26,000,000 -731,000,000 -2,000,000 -1,225,000,000 -731,000,000 -2,000,000 -1,225,000,000 -290,000,000 333,000,000 -4,224,000,000 -610,000,000 -76,000,000 -7,542,000,000 320,000,000 409,000,000 3,318,000,000 33 Change in Accrued Expenses 34 Change in Other Current Liabilities 35 Change in Other Operating Capital 36 Cash Flow from Investing Activities 37 Cash Flow from Continuing Investing Activities 38 Payment for Loan Granted and Repayments Received, Net 39 Purchase/Sale and Disposal of Property, Plant and Equipment, Net 40 Purchase of Property, Plant and Equipment 41 Sale and Disposal of Property, Plant and Equipment 42 Purchase/Sale of Business, Net 43 Purchase/Acquisition of Business 44 Purchase/Sale of Investments, Net 45 Purchase of Investments 46 Sale of Investments 47 Purchase/Sale of Other Non-Current Assets, Net 48 Other Investing Cash Flow 49 Cash Flow from Financing Activities 50 Cash Flow from Continuing Financing Activities 51 Issuance of/Payments for Common Stock, Net 52 Proceeds from Issuance of Common Stock 53 Payments for Common Stock 54 Issuance of/Repayments for Debt, Net 55 Issuance of/Repayments for Long Term Debt, Net 56 Proceeds from Issuance of Long Term Debt 57 Repayments for Long Term Debt 58 Issuance of/Repayments for Short Term Debt, Net 59 Repayments for Short Term Debt 60 Other Financing Cash Flow 61 Excess Tax Benefit from Share-Based Compensation, Financing Activities 62 Net Movement in Non-Controlling/Minority Interest 63 Cash and Cash Equivalents, End of Period 64 Change in Cash 65 Effect of Exchange Rate Changes 66 Cash and Cash Equivalents, Beginning of Period 67 Change in Cash as Reported, Supplemental 68 Income Tax Paid, Supplemental 69 Interest Paid, Supplemental Ratios Income Statement Balance Sheet Cash Flows 484,000,000 -85,000,000 -85,000,000 0 0 -362,000,000 575,000,000 -51,000,000 3,079,000,000 -51,000,000 3,079,000,000 75,000,000 75,000,000 -133,000,000 -862,000,000 -21.000.000 -21,000,000 -133,000,000 -133,000,000 0 76.000.000 -28,000,000 1,604,000,000 187.000.000 3,000,000 1,414,000,000 190.000.000 -28,000,000 - 14,000,000 -862,000,000 -862,000,000 0 -18,000,000 41,000,000 26,000,000 -71,000,000 3,858,000,000 2,201,000,000 1,393,000,000 623,000,000 -764,000,000 -26,000,000 -44,000,000 1,604,000,000 2,201,000,000 597,000,000 -808,000,000 -47,000,000 -216,000,000 - 19,000,000 - 16,000,000 +