Introduction PP For centuries, First Peoples have enjoyed fishing as a food source and for trade, But in recent decades, excessive commercialization, overfishing and mismanagement
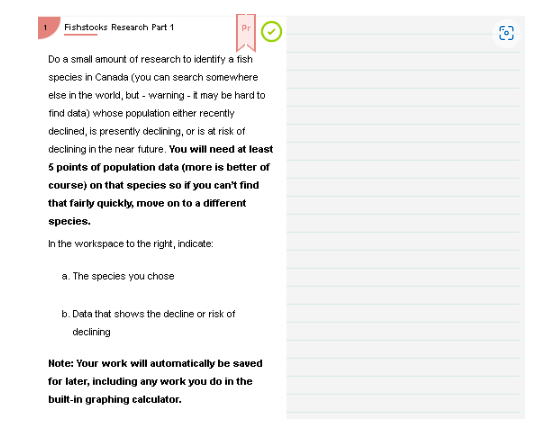
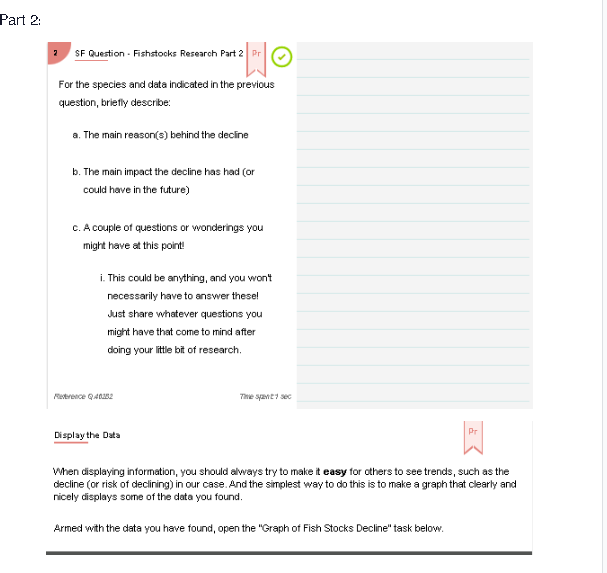
Introduction PP For centuries, First Peoples have enjoyed fishing as a food source and for trade, But in recent decades, excessive commercialization, overfishing and mismanagement of fish stocks have put some modern fishing needs in jeopardy! Consider the following quote from the Report to the Pacific Fisheries Resource Conservation Council, as it pertains to just one fish species, salmon "First Nations communities on the [west coast of Canada] ...have a long documented history of fishing particular runs of salmon in particular places at particular times of the year, that go back, literally, thousands of years. ..Perhaps one of the greatest challenges confronting modern-day fisheries managers is that as concerns for salmon conservation became heightened in the 1990s, so did public recognition that First Nations" people had constitutionally protected rights to fish for food, social and ceremonial purposes, rights that court rulings tell us are superseded only by conservation. It is no understatement to say that the dovetailing of these two realities pose significant challenges and, it is hoped, opportunities in the years ahead as fisheries managers and the main participants in the fishery learn to both conserve salmon, ensure that First Nations rights and interests are respected..." The truth is, the mismanagement and dwindling supply of fish stocks affect many societies all over the world, and is not limited to salmon species alone but apply to many different kinds of fish. The good news, however, is that it doesn't have to stay like this. In this project, you will explore and analyze some fish stocks by putting on the hat of a Fishery Manager! (A fishery manager who is also proficient in mathematics!) You'll do a bit of research, then do some calculations and projections, and finally you'll make some simple recommendations for a safer course of action for our future. Part 1: Per PRELIMINARY RESEARCH Do a small amount of research to identify a fish species in Canada (you can search somewhere else in the world, but- warning - it may be hard to find data) whose population either recently declined, is presently declining, or is at risk of declining in the near future. You will need at least 5 points of population date on that species (more data is better of course) so if you can't find that fairly quickly, move on to a different species. *Huge time-saver!* For the actual data, look here: {Simplest) Canada's Commercial Fisheries Date (Use "Landings"} . {Harder to sort): Canada's Recreational Fishing Dats You can record your findings in the task below.1 Fishstocks Research Part 1 PT Do a small amount of research to identify a fish species in Canada (you can search somewhere else in the world, but - warning - it may be hard to find data) whose population either recently declined, is presently declining, or is at risk of declining in the near future. You will need at least 5 points of population data (more is better of course) on that species so if you can't find that fairly quickly, move on to a different species. In the workspace to the right, indicate: a. The species you chose b. Data that shows the decline or risk of declining Note: Your work will automatically be saved for later, including any work you do in the built-in graphing calculator.Part 2: SF Question . Fishstocks Research Part 2 |Pr O For the species and data indicated in the previous question, briefly describe: a. The main reason(s) behind the decline b. The main impact the decline has had (or could have in the future) c. A couple of questions or wonderings you might have at this point! i. This could be anything, and you won't necessarily have to answer these! Just share whatever questions you might have that come to mind after doing your little bit of research. The SCANT SG Display the Data PT When displaying information, you should always try to make it easy for others to see trends, such as the decline (or risk of declining) in our case. And the simplest way to do this is to make a graph that clearly and nicely displays some of the data you found. Armed with the data you have found, open the "Graph of Fish Stocks Decline" task below.Part 3: Graph of Fish Stocks Decline Pr Create graph - or table - that clearly and nicely displays some of the data you found. (If you need a hint, use the detailed solution.) Note: Your work will automatically be saved for later, including any work you do in the built-in graphing calculator. Solution 10 stops not yet viewed The SEVENMePP Modelling The Data Now we're going to have some fun! We're going to use regression analysis to find a function which best fits the data. You will first use something called the Logistic Growth Equation, a common equation for population data, and then you'll try and find another equation that perhaps fits even better! Of course, you need to get your data into a graphing calculator before you can do a regression. You may have already done this, but if not, there is a fast way to plot your data in any spreadsheet, then Copy and Paste it into the built-in graphing calculator (powered by Desmos). Watch the next video for how to do that Modelling The Data #2 PT Well, it's time to do some regression! In the task that follows, you're going to determine TWO regression equations 1. The Logistic Growth Equation (see below for more info) 2. Another Equation of Your Choice (linear, quadratic, exponential, logarithmic, etc). You will calculate and graph both of these regressions on the same grid in the built-in Graphing Calculator. Then you will upload a screenshot of this in the workspace to the right. Okay, time to get at it below! Have fun! NOTE: MORE ON THE LOGISTIC GROWTH EQUATION(If You're Curious!) If you're curious, the Logistic Growth Equation is a common population model, based on a very useful and famous differential equation. It specializes in situations where the environment can only sustain a certain maximum population (Ex. deer over-populating in an area will eventually tend towards a limit) D Definition Logistic Growth The solution to the differential equation dy - ky (1 - M) is given by The Logistic Growth Equation: y = where y is the population, A is the Maximum Population (or Carrying Capacity ), & is the growth rate, and A is a constant unique to each situation.Part 4: Modelling The Data, Equations, and Predictions 3. Modeling the Data: Use the regression technique shown earlier to determine the following TWO regression equations: i. The Logistic Growth Equation M M 1. IMPORTANT!! DO NOT Uses negativevalue for "\\" in the regression: P ~ P ~ or itwill USE 1 + Ae" NOT 1 + Ae-ki not cakubo property! I.Another Equation of your choice (linear, quadratk, exponential, logarithmic, ). Be sure to choose the one that fits your data the best!Onceyou have the graphs of both equations showing on the some graph, you are done! Ifyou return to this btw, twillstill be there for you For an example of how to identify your actual regression equation, see the Doesa led Solution] Partbite RESIDUALS - 09717 PARAMITE be -4025OS - 4774.14 HTI step2 Your recreation equation would be: Step a P = 14.9048/- - 402.595r + 4774.14. b. Predictions Using Your Models: Answer the folowing questions. i. Predict the population 5years from now. (Show the bulation for both equations) Note: If you do your work by hand, you must upload a picture or scan of your work. i. Determine how ling until the population will be ata of tical level for, If the data salready of coat determine how long until the population will be almost zero.(Show this calculation for both of your equations) Besure to provide an explanation as to how you identified the "critical" level.Part 5: 5 Regression Model Analysis Pr Answer the following questions to help you analyze how feasible your regression models are: a. Does your original data have any outliers - data points which seem out of place (extremely large or small compared to the rest of the data)? If so, how did this affect your regression equation? (You could temporarily remove the outlier to see how the equation changes.) b. Which of the two models/equations best describes/matches the actual data and why? c. By looking at the graphs you found, consider the future trend (as time gets larger and larger) of the two regression equations you found. Does the future trend match your actual data and why do you think that is the case?Part 6: 6 Conclusion Pr a, Using all of your calculations so far, describe what you feel the data and your analysis shows. Include whether you are concerned about the population - and why or why not - and include terms like Regression equation, Prediction, Population growth rate, etc. b. What's one piece of advice you'd give, and who would you specifically give it to (ex. commercial fishers, the government, the society in general, educators, students, etc)? Reverence Q.46300 Time spent: 1 sec HI, please follow all the steps and rules. Make sure all the graph, data and answers are correct. It is worth a lot of marks just make sure everything is followed and calculated properly. you can use the desmos calculator for regression and stuff and please indicate any equations and calculations you do. Thank you in advance! god bless you )
Step by Step Solution
There are 3 Steps involved in it
Step: 1
Get Instant Access to Expert-Tailored Solutions
See step-by-step solutions with expert insights and AI powered tools for academic success
Step: 2
Step: 3
Ace Your Homework with AI
Get the answers you need in no time with our AI-driven, step-by-step assistance