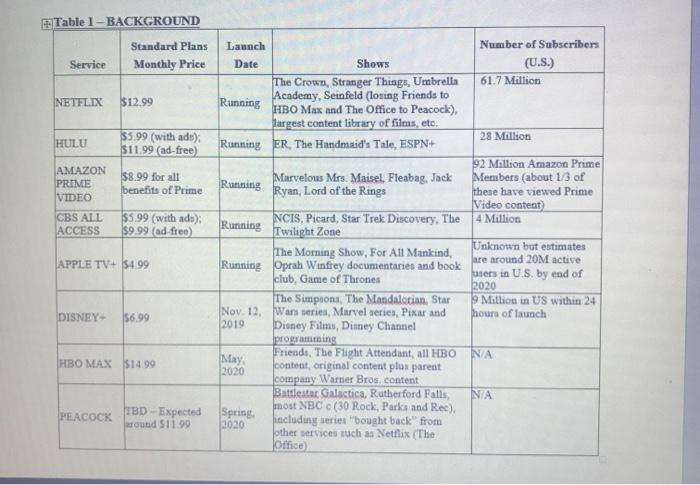
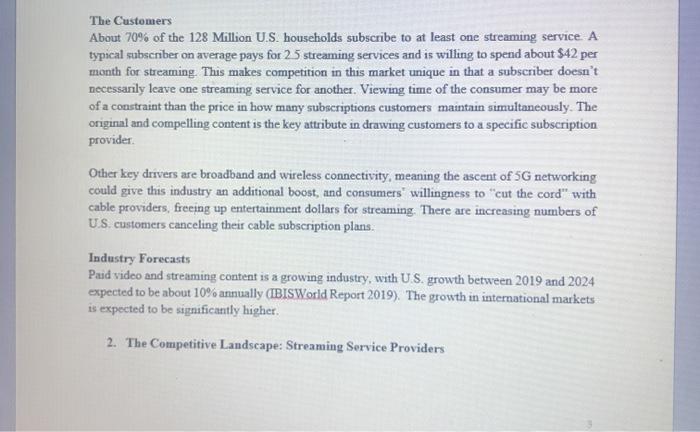
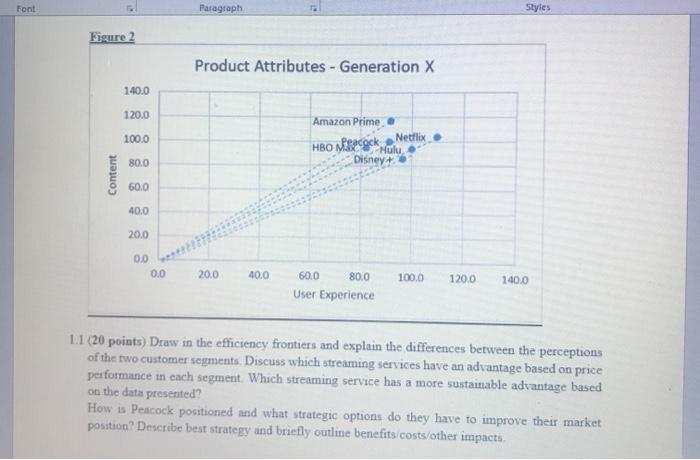
Introduction - The Streaming Video Services Market in 2019 The U.S.A. Internet Publishing and Broadcasting is a $141 Billion industry in 2019, with paid video and streaming content representing about 25% of revenues (IBIS World Report, 2019). Video streaming world has until recently been dominated by relative newcomers such as Netflix with projected $75 Billion in U.S. revenue, and over $20 Billion revenue worldwide for 2019. However, this market is experiencing many disruptions, one of them resulting from the shifting trends as customers shop for content' directly from services such as Netflix and Hulu. The market dynamics in streaming services are challenging dominant broadcasting, cable, and entertainment industries. Traditional media giants such as Disney and NBCUniversal have recently entered this market with their own subscription services (Disney+ and Peacock respectively). Traditional cable providers such as Comcast (and a media company) and AT&T have been slow to promote their streaming service as it leads to cannibalization of their cable business (NBCUniversal for Comcast and TimeWarner for AT&T), despite the benefit of owning more of the traditional entertainment industry supply chain Table 1-BACKGROUND Standard Plans Monthly Price Service Number of Subscribers (U.S.) 61.7 Million Launch Date Shows The Crown, Stranger Things, Umbrella Running Academy, Seinfeld (losing Friends to HBO Max and The Office to Peacock). largest content library of films, etc. Running ER, The Handmaid's Tale ESPN+ NETFLIX $12.99 HULU 35.99 (with ads) $11.99 (ad-free AMAZON PRIME VIDEO $8.99 for all benefits of Prime 28 Million 92 Million Amazon Prime Members (about 13 of these have viewed Prime Video content 4 Million CBS ALL ACCESS $5.99 (with ado); $9.99 (ad-free) APPLE TV+ $4.99 Unknown but estimates are around 20M active users in U.S. by end of 2020 9 Million in US within 24 hours of launch DISNEY- Running Marvelous Mrs. Maisel. Fleabag, Jack Ryan, Lord of the Rings Running NCIS, Picard, Star Trek Discovery, The Twilight Zone The Morning Show, For All Mankind, Running Oprah Winfrey documentaries and book club, Game of Thrones The Simpson, The Mandalotion. Star Nov. 12, Wars series, Marvel series, Pixar and 2019 Disney Filmu, Dimney Channel programming May Friends, The Flight Attendant, all HBO 2020 content, original content plus parent company Warner Bros content Battlestar Galactica, Rutherford Falls, most NBCC (30 Rock, Parks and Ree) Spring 2020 including series "bought back from other services such as Netflix (The Office $6.99 NA HBO MAX $14.99 NA PEACOCK TBD - Expected around $11.99 1. The Supply Chain The supply chain for streaming services includes specialized labor (for programming algorithms and streaming delivery, IT, design, marketing, sales and content acquisition), content (TV series, movies, documentaries, comedy or concert specials), streaming data centers, cloud access and storage, and utilities including internet access. The service is distributed directly to users who subscribe through their own internet connection or mobile device, although some services come preinstalled on hardware such as an internet TV. Amazon Prime and soon the Apple TV app sell access to other subscriptions such as HBO, or to non-subscription purchases of series, individual episodes, or movies. There are varying degrees and types of vertical integration in the industry Cost Structure The business model of streaming services consists of high fixed and low variable costs. The most expensive part of the service providers in this industry is the creation of original content and licensing, when not owning extensive movie or TV program catalogs. Additionally, streaming services invest increasing resources in marketing to promote original content. Most content licensing agreements are negotiated for unrestricted usage based on estimated user levels, and do not involve individual royalties for viewing. Data center and labor costs are fixed. Variable costs include a low level of royalties and very low customer service costs. Font Paragraph Netflix: Netflix entered the streaming market in 2007 as the only streaming service. Early on Netflix understood that in order to build advantage in this market they needed to create original content. In 2018 Netflix is reported to have spent 15B on new shows. Netflix continues to lose money and is facing many and deep pocket competitors, some of which are major content owners and producers. Hulu: Hulu entered streaming service soon after Netflix in 2007. Originally started as a joint venture by TimeWarner, Comcast/NBCUniversal , AT&T and Disney, now Hulu is solely owned by Disney, but will continue to license NBCUniversal programming through 2024. At 28 million subscribers, it has the second or third largest customer base depending upon how many Amazon Prime customers can be counted as Amazon Prime Video viewers. Amazon Prime: Amazon's strategy with Amazon Prime Video is to provide enough original and licensed content to drive traffic to the Amazon platform. Its purpose is also to drive purchases (and thereby additional revenue streams) of other video content and streaming services that is not part of the Prime package. While original content is extremely important to Amazon, its strategic focus seems to be on the internet dominance and less so on dominating the streaming market. Amazon does not disclose how many of their 92 million Prime members are also viewers of Prime video HBO Max HBO owns some of the most popular and biggest shows in streaming HBO's pricing of its streaming service at $14.99/month is most expensive in the industry. HBO spent 14.3B on original content in 2018 for its cable and streaming services, and with the acquisition of Time Warner, HBO's parent company, by AT&T, the original content spending has increased. HBO faunched HBOMax in November 2019, as an upgrade (and competitor) to its HBO Now service: HBOMax delivers HBO and Time Warner content, One pricing concern for HBO is that HBO streaming competes with HBO subscription cable offerings NBC Peacock. Now that Comcast/NBCUniversal has divested from Hulu, it is launching its own streaming subscription service, featuring legacy NBC content, such as 30 Rock and The Office, as well as new original programming Like Disney, it is forgoing licensing revenues on some of its original shows, like The Office, but others, such as Friends, it continues to license at extremely high prices. (HBOMax paid almost $SOOM for a five year exclusive license for Friends) Pricing is not yet finalized, but early indications suggest prices of $11.99 for its ad-free service, with a lower priced -- or possibly free-service funded by advertising Apple TV+ At $4.99/month, Apple TV+ streaming for now has the least amount of original content. Apple's plans to offer free Apple TV+ streaming for a year with every Apple mobile device guarantees high viewership while it aims to build up its content library. Apple's TV+ strategy is probably more focused on increasing brand stickiness than becoming a streaming video content company. However, with so many loyal customers, Apple TV+ contributes to increasing uncertainty in this industry, QUESTION 1: THE PRODUCT DEFINITION (Total 20 points) In Spring 2020 NBC Peacock is considering its preliminary launch pricing decision of $11.99/month, and examining its position relative to competitors. According to CNN Entertainment Analyst Frank Perotta, consumers have three main considerations when choosing a streaming service, price of the service and two attributes content and user experience, which includes individual user viewing recommendation algorithms and the user interface (including ease of mobile downloads and device support) The product attribute model is ideal for comparing services of various providers in the relevant market. Perceived positioning of streaming service providers in two target markets is presented in Figures 1 and 2. Fagure I provides information on perceived provider positioning for the Families with Young Children" demographic. Figure 2 provides the same information for the Generation X demographic (ages 39 to 55). The underlying data relies on user focus groups in each demographic rating the services content and user experiences on a scale of 0 to 100, and the endpoints reflect the current monthly prices of each service and a user budget for streaming services of $30 per month Figure 1 Product Attributes - Family Demographic Disney + Content 200.0 180.0 160,0 140.0 120.0 100.0 800 60.0 40.0 20,0 0.0 0.0 Amazon Prime Peacock HBO Max Hull 20.0 400 100.0 120.0 140.0 60.0 80.0 User Experience Font Paragraph Styles Figure 2 Product Attributes - Generation X 140.0 120.0 100.0 Amazon Prime Netflix HBO MESAS Mulu Disney 80.0 Content 60.0 40.0 20.0 0.0 0.0 20.0 40.0 100.0 120.0 140.0 60.0 80.0 User Experience 1.1 (20 points) Draw in the efficiency frontiers and explain the differences between the perceptions of the two customer segments. Discuss which streaming services have an advantage based on price performance in each segment. Which streaming service has a more sustainable advantage based on the data presented? How is Peacock positioned and what strategic options do they have to improve their market position? Describe best strategy and briefly outline benefits costs/other impacts. Introduction - The Streaming Video Services Market in 2019 The U.S.A. Internet Publishing and Broadcasting is a $141 Billion industry in 2019, with paid video and streaming content representing about 25% of revenues (IBIS World Report, 2019). Video streaming world has until recently been dominated by relative newcomers such as Netflix with projected $75 Billion in U.S. revenue, and over $20 Billion revenue worldwide for 2019. However, this market is experiencing many disruptions, one of them resulting from the shifting trends as customers shop for content' directly from services such as Netflix and Hulu. The market dynamics in streaming services are challenging dominant broadcasting, cable, and entertainment industries. Traditional media giants such as Disney and NBCUniversal have recently entered this market with their own subscription services (Disney+ and Peacock respectively). Traditional cable providers such as Comcast (and a media company) and AT&T have been slow to promote their streaming service as it leads to cannibalization of their cable business (NBCUniversal for Comcast and TimeWarner for AT&T), despite the benefit of owning more of the traditional entertainment industry supply chain Table 1-BACKGROUND Standard Plans Monthly Price Service Number of Subscribers (U.S.) 61.7 Million Launch Date Shows The Crown, Stranger Things, Umbrella Running Academy, Seinfeld (losing Friends to HBO Max and The Office to Peacock). largest content library of films, etc. Running ER, The Handmaid's Tale ESPN+ NETFLIX $12.99 HULU 35.99 (with ads) $11.99 (ad-free AMAZON PRIME VIDEO $8.99 for all benefits of Prime 28 Million 92 Million Amazon Prime Members (about 13 of these have viewed Prime Video content 4 Million CBS ALL ACCESS $5.99 (with ado); $9.99 (ad-free) APPLE TV+ $4.99 Unknown but estimates are around 20M active users in U.S. by end of 2020 9 Million in US within 24 hours of launch DISNEY- Running Marvelous Mrs. Maisel. Fleabag, Jack Ryan, Lord of the Rings Running NCIS, Picard, Star Trek Discovery, The Twilight Zone The Morning Show, For All Mankind, Running Oprah Winfrey documentaries and book club, Game of Thrones The Simpson, The Mandalotion. Star Nov. 12, Wars series, Marvel series, Pixar and 2019 Disney Filmu, Dimney Channel programming May Friends, The Flight Attendant, all HBO 2020 content, original content plus parent company Warner Bros content Battlestar Galactica, Rutherford Falls, most NBCC (30 Rock, Parks and Ree) Spring 2020 including series "bought back from other services such as Netflix (The Office $6.99 NA HBO MAX $14.99 NA PEACOCK TBD - Expected around $11.99 1. The Supply Chain The supply chain for streaming services includes specialized labor (for programming algorithms and streaming delivery, IT, design, marketing, sales and content acquisition), content (TV series, movies, documentaries, comedy or concert specials), streaming data centers, cloud access and storage, and utilities including internet access. The service is distributed directly to users who subscribe through their own internet connection or mobile device, although some services come preinstalled on hardware such as an internet TV. Amazon Prime and soon the Apple TV app sell access to other subscriptions such as HBO, or to non-subscription purchases of series, individual episodes, or movies. There are varying degrees and types of vertical integration in the industry Cost Structure The business model of streaming services consists of high fixed and low variable costs. The most expensive part of the service providers in this industry is the creation of original content and licensing, when not owning extensive movie or TV program catalogs. Additionally, streaming services invest increasing resources in marketing to promote original content. Most content licensing agreements are negotiated for unrestricted usage based on estimated user levels, and do not involve individual royalties for viewing. Data center and labor costs are fixed. Variable costs include a low level of royalties and very low customer service costs. Font Paragraph Netflix: Netflix entered the streaming market in 2007 as the only streaming service. Early on Netflix understood that in order to build advantage in this market they needed to create original content. In 2018 Netflix is reported to have spent 15B on new shows. Netflix continues to lose money and is facing many and deep pocket competitors, some of which are major content owners and producers. Hulu: Hulu entered streaming service soon after Netflix in 2007. Originally started as a joint venture by TimeWarner, Comcast/NBCUniversal , AT&T and Disney, now Hulu is solely owned by Disney, but will continue to license NBCUniversal programming through 2024. At 28 million subscribers, it has the second or third largest customer base depending upon how many Amazon Prime customers can be counted as Amazon Prime Video viewers. Amazon Prime: Amazon's strategy with Amazon Prime Video is to provide enough original and licensed content to drive traffic to the Amazon platform. Its purpose is also to drive purchases (and thereby additional revenue streams) of other video content and streaming services that is not part of the Prime package. While original content is extremely important to Amazon, its strategic focus seems to be on the internet dominance and less so on dominating the streaming market. Amazon does not disclose how many of their 92 million Prime members are also viewers of Prime video HBO Max HBO owns some of the most popular and biggest shows in streaming HBO's pricing of its streaming service at $14.99/month is most expensive in the industry. HBO spent 14.3B on original content in 2018 for its cable and streaming services, and with the acquisition of Time Warner, HBO's parent company, by AT&T, the original content spending has increased. HBO faunched HBOMax in November 2019, as an upgrade (and competitor) to its HBO Now service: HBOMax delivers HBO and Time Warner content, One pricing concern for HBO is that HBO streaming competes with HBO subscription cable offerings NBC Peacock. Now that Comcast/NBCUniversal has divested from Hulu, it is launching its own streaming subscription service, featuring legacy NBC content, such as 30 Rock and The Office, as well as new original programming Like Disney, it is forgoing licensing revenues on some of its original shows, like The Office, but others, such as Friends, it continues to license at extremely high prices. (HBOMax paid almost $SOOM for a five year exclusive license for Friends) Pricing is not yet finalized, but early indications suggest prices of $11.99 for its ad-free service, with a lower priced -- or possibly free-service funded by advertising Apple TV+ At $4.99/month, Apple TV+ streaming for now has the least amount of original content. Apple's plans to offer free Apple TV+ streaming for a year with every Apple mobile device guarantees high viewership while it aims to build up its content library. Apple's TV+ strategy is probably more focused on increasing brand stickiness than becoming a streaming video content company. However, with so many loyal customers, Apple TV+ contributes to increasing uncertainty in this industry, QUESTION 1: THE PRODUCT DEFINITION (Total 20 points) In Spring 2020 NBC Peacock is considering its preliminary launch pricing decision of $11.99/month, and examining its position relative to competitors. According to CNN Entertainment Analyst Frank Perotta, consumers have three main considerations when choosing a streaming service, price of the service and two attributes content and user experience, which includes individual user viewing recommendation algorithms and the user interface (including ease of mobile downloads and device support) The product attribute model is ideal for comparing services of various providers in the relevant market. Perceived positioning of streaming service providers in two target markets is presented in Figures 1 and 2. Fagure I provides information on perceived provider positioning for the Families with Young Children" demographic. Figure 2 provides the same information for the Generation X demographic (ages 39 to 55). The underlying data relies on user focus groups in each demographic rating the services content and user experiences on a scale of 0 to 100, and the endpoints reflect the current monthly prices of each service and a user budget for streaming services of $30 per month Figure 1 Product Attributes - Family Demographic Disney + Content 200.0 180.0 160,0 140.0 120.0 100.0 800 60.0 40.0 20,0 0.0 0.0 Amazon Prime Peacock HBO Max Hull 20.0 400 100.0 120.0 140.0 60.0 80.0 User Experience Font Paragraph Styles Figure 2 Product Attributes - Generation X 140.0 120.0 100.0 Amazon Prime Netflix HBO MESAS Mulu Disney 80.0 Content 60.0 40.0 20.0 0.0 0.0 20.0 40.0 100.0 120.0 140.0 60.0 80.0 User Experience 1.1 (20 points) Draw in the efficiency frontiers and explain the differences between the perceptions of the two customer segments. Discuss which streaming services have an advantage based on price performance in each segment. Which streaming service has a more sustainable advantage based on the data presented? How is Peacock positioned and what strategic options do they have to improve their market position? Describe best strategy and briefly outline benefits costs/other impacts