Answered step by step
Verified Expert Solution
Question
1 Approved Answer
Introduction to business chapter 12: Calculate net profit ratio, gross profit ratio, cost of sales ratio, current ratiob and the quick ratio This is the
Introduction to business chapter 12: Calculate net profit ratio, gross profit ratio, cost of sales ratio, current ratiob and the quick ratio 


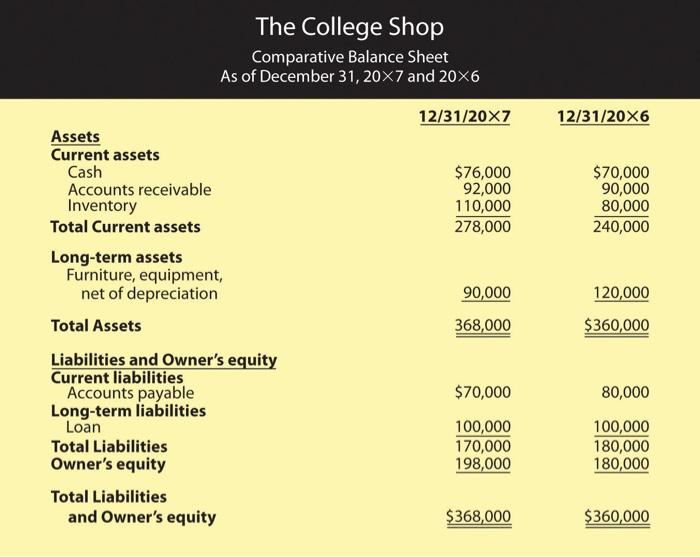
This is the balence sheet 
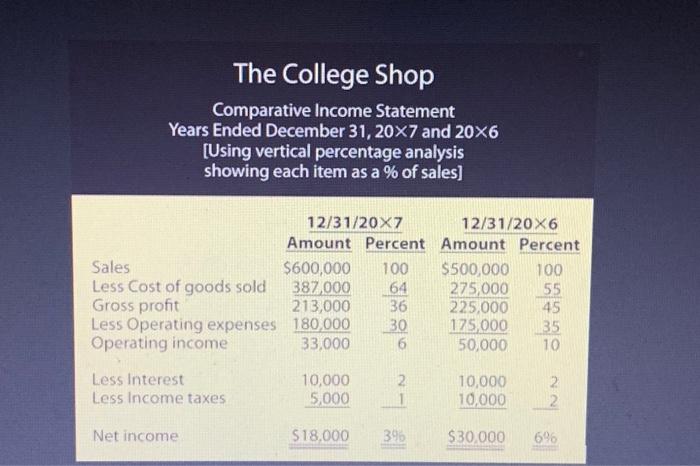
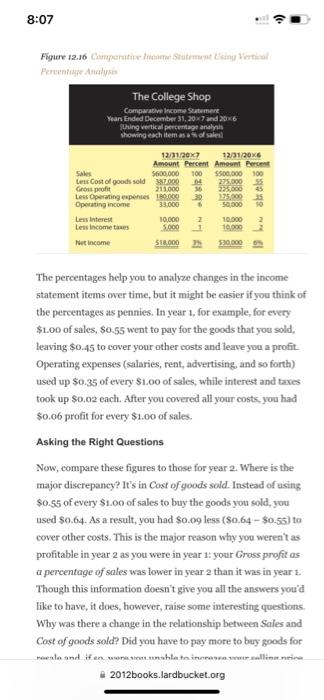
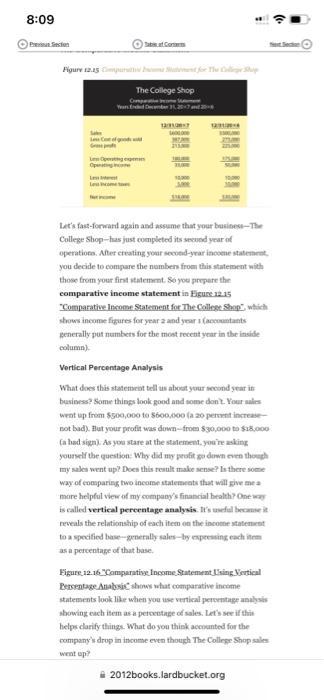
The College Shop Comparative Income Statement Years Ended December 31, 207 and 206 [Using vertical percentage analysis showing each item as a % of sales] Fercutage Anatysion The percentages help you to analyze changes in the income statement items over time, but it might be easier if you think of the peroentages as pennies. In year 1, for example, for every $1.00 of sales, $0.55 went to pay for the goods that you sold, leaving $0.45 to cover your other costs and leave you a profit. Operating expenses (salaries, rent, advertising, and so forth) used up $0.35 of every $1.00 of sales, while interest and taxes took up $0,02 each. After you covered all your costs, you had $0.06 profit for every $1.00 of sales. Asking the Right Questions Now, compare these figures to those for year 2 . Where is the major discrepancy? It's in Cost of goods sold. Instead of using $0.55 of every $1.00 of sales to buy the goods you sold, you used $0.64. As a result, you had $0.09 less ($0.64$0.55) to cover other costs. This is the major reason why you weren't as profitable in year 2 as you were in year 1: your Gross profit as a percentage of sales was lower in year 2 than it was in year 1. Though this information doesn't give you all the answers you'd like to have, it does, however, raise some interesting questions. Why was there a change in the relationship between Soles and Cost of goods sold? Did you have to pay mote to buy goods for Houry ta.25 Let's fass-forwant agsin and wssume that your busifese-Ther Cullege Shop-has just conpleted its secund yoar at operations. After creating your scoted-yrar inooene statemhent. you decide to compare the numbers from this statement with those from your fird itmiement. So yoe propere ther comparative income statement in Higuse 12.15 "Comparative lnacome Stateanent for The Callest Shap" whict shows income figures for year 2 and your t (accomtants Benerally put numbets for the most recent yoar in the insiche column). Vertical Percentage Analysis What does this statemciat bell us abocat ytur moond year in busimess? Kome things look good and mome dont. Your anlem Wwat up from $500,000 to $600,600 \{a 20 perwnt incteaseBot bad). lut your profit was down=-frote 5300,000 to $18,000 (a had sign). As you stare at the stalement. youire asking my sales went upi Does this result make sense? Is there some way of coenparisg two incomen staletecats that wall give me a more helpful view of my sompany's financial heralth? One mal is called vertical pereentage analysis. It's useful hocame it neveals the relationship of each item on the incone sitatemacte to a mpecified base-grnerally sales-by emperasing each iltrem as a percentane of that base. Higure 12.16 *Comparative Income_Statement t fring Wortical Percentage Arialosic" shows what counparative incame statements look like when you tise vertical perorntioge analysihs showing each item as a petextage of sales. Let's see if thin helpsclarify things. What do you thiek accounted for the campany's drop in income even though The College Shop sales weat up? The College Shop Comparative Balance Sheet As of December 31,207 and 206 12/31/20712/31/206 Assets Current assets Cash Accounts receivable Inventory Total Current assets Long-term assets Furniture, equipment, net of depreciation Total Assets Liabilities and Owner's equity Current liabilities Accounts payable Long-term liabilities Loan Total Liabilities Owner's equity Total Liabilities and Owner's equity \begin{tabular}{rr} $76,000 & $70,000 \\ 92,000 & 90,000 \\ 110,000 & 80,000 \\ \hline 278,000 & 240,000 \end{tabular} 90,000368,000120,000$360,000 \begin{tabular}{lr} $70,000 & 80,000 \\ 170,000100,000 & 100,000 \\ 198,000 & 180,000 \\ \hline \end{tabular} $368,000 $360,000 
Step by Step Solution
There are 3 Steps involved in it
Step: 1

Get Instant Access to Expert-Tailored Solutions
See step-by-step solutions with expert insights and AI powered tools for academic success
Step: 2

Step: 3

Ace Your Homework with AI
Get the answers you need in no time with our AI-driven, step-by-step assistance
Get Started


