Question
Inventories are stocks or items used to support production (raw materials and work-in-process items), supporting activities (maintenance, repair, and operating supplies) and customer service (finished
Inventories are stocks or items used to support production (raw materials and work-in-process items), supporting activities (maintenance, repair, and operating supplies) and customer service (finished goods and spare parts). Inventories are a vital part of business: (1) necessary for operations and (2) contribute to customer
satisfaction.
The annual inventory cost is the sum of two costs: holding and ordering costs. It can be expressed as:
![]()
where
Q → order quantity (this is the decision variable)
H → unit holding cost ($)
D → annual demand
S → ordering cost ($), the expense incurred each time an order is placed such as shipping cost, etc. Note that D/Q is the order frequency, the number of orders placed during the year. For example, if annual demand D=100 units, and if you order Q=20 units at a time, then in total there would be D/Q=5 orders. And if it costs $10 each time to place an order, then the annual ordering cost is $10 x 5=$50.
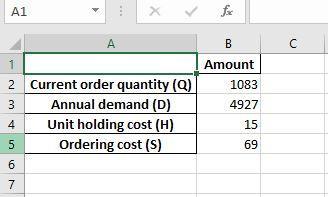
Your objective is to help the company by determining EOQ* (Economic Order Quantity) that minimizes the total inventory cost for a company that sells ceiling fans. Your worksheet provides information about the current order quantity, demand quantity, and other costs.
Questions
a. With the current order quantity, what is the total cost of inventory?
b. Implement the problem in Excel and find the order quantity (round to the nearest integer) and minimum inventory cost. Note: this is a Non-linear programming, hence select “GRG Nonlinear” method in Solver
- How much money would the company save by switching to the optimum quantity from the current order quantity?
c. Once you find the optimal order quantity EOQ, create a Data Table that generates inventory cost within ±100 units (with 10 units increment) from the optimal order quantity. For example, if the order quantity=150, then you need to generate Data Table for inventory cost starting from 50 to 250 with 10 increments.
d. Create a Scatter plot with “smooth lines” for the Data Table created in c) to show the inventory cost. Label your plot clearly (axis and title). The optimum order quantity should indicate the minimum cost in your plot.

= () H+ (2) S TC(Q)=
Step by Step Solution
There are 3 Steps involved in it
Step: 1
turnover ratio is a measure of how efficiently a company manages its inventory It indicates the number of times inventory is sold and replaced within a given period The formula for calculating the inv...
Get Instant Access to Expert-Tailored Solutions
See step-by-step solutions with expert insights and AI powered tools for academic success
Step: 2

Step: 3

Ace Your Homework with AI
Get the answers you need in no time with our AI-driven, step-by-step assistance
Get Started


