

Answered step by step
Verified Expert Solution
Question
1 Approved Answer
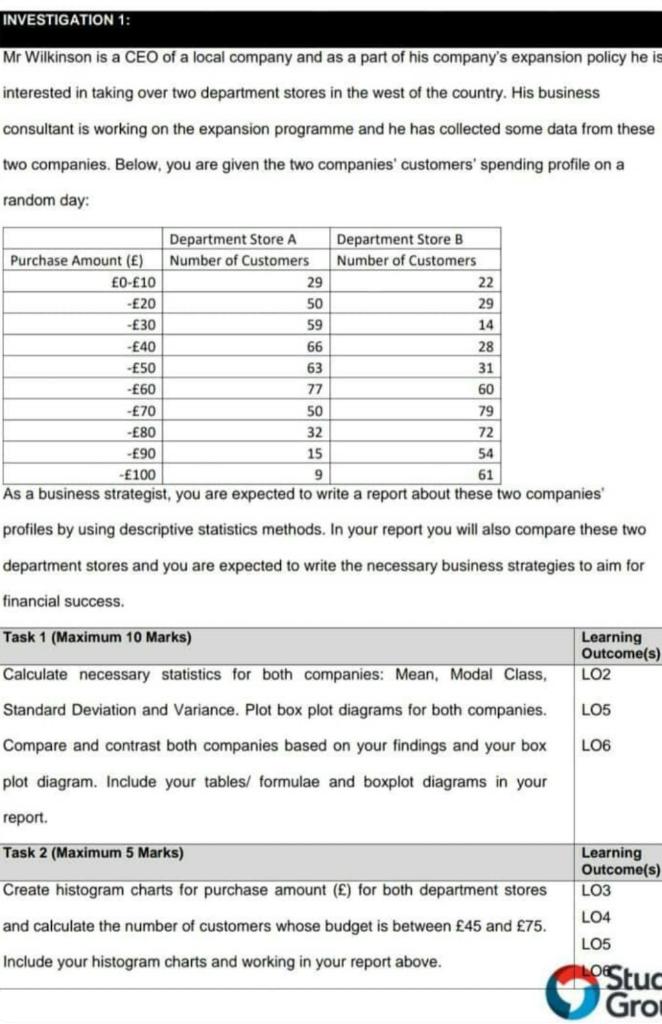
INVESTIGATION 1: Mr Wilkinson is a CEO of a local company and as a part of his company's expansion policy he is interested in taking
Step by Step Solution
There are 3 Steps involved in it
Step: 1

Get Instant Access to Expert-Tailored Solutions
See step-by-step solutions with expert insights and AI powered tools for academic success
Step: 2

Step: 3
Ace Your Homework with AI
Get the answers you need in no time with our AI-driven, step-by-step assistance
Get Started
Handbook Of European Financial Markets And Institutions
Authors: Xavier Freixas, Philipp Hartmann, Colin Mayer
1st Edition
0199229953, 978-0199229956