Answered step by step
Verified Expert Solution
Question
1 Approved Answer
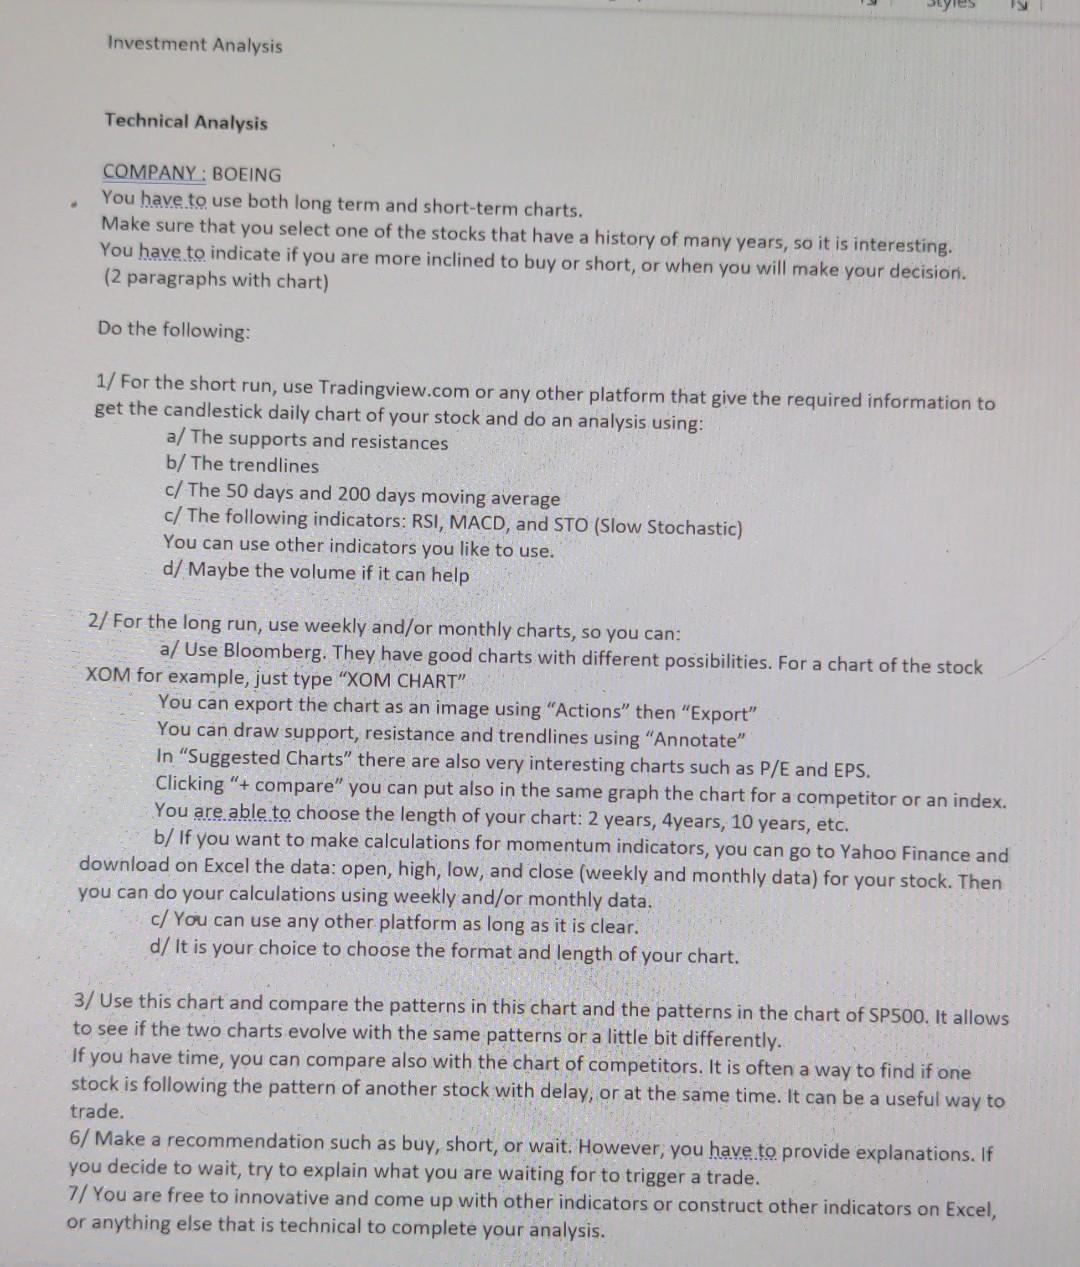
Investment Analysis Technical Analysis COMPANY: BOEING You have to use both long term and short-term charts. Make sure that you select one of the stocks

Investment Analysis Technical Analysis COMPANY: BOEING You have to use both long term and short-term charts. Make sure that you select one of the stocks that have a history of many years, so it is interesting. You have to indicate if you are more inclined to buy or short, or when you will make your decision. (2 paragraphs with chart) Do the following: 1/ For the short run, use Tradingview.com or any other platform that give the required information to get the candlestick daily chart of your stock and do an analysis using: a/ The supports and resistances b/ The trendlines c/ The 50 days and 200 days moving average c/ The following indicators: RSI, MACD, and STO (Slow Stochastic) You can use other indicators you like to use. d/ Maybe the volume if it can help 2/ For the long run, use weekly and/or monthly charts, so you can: a/ Use Bloomberg. They have good charts with different possibilities. For a chart of the stock XOM for example, just type "XOM CHART You can export the chart as an image using "Actions" then "Export" You can draw support, resistance and trendlines using "Annotate" In "Suggested Charts there are also very interesting charts such as P/E and EPS. Clicking " + compare" you can put also in the same graph the chart for a competitor or an index. You are able to choose the length of your chart: 2 years, 4years, 10 years, etc. b/ If you want to make calculations for momentum indicators, you can go to Yahoo Finance and download on Excel the data: open, high, low, and close (weekly and monthly data) for your stock. Then you can do your calculations using weekly and/or monthly data. c/ You can use any other platform as long as it is clear. d/ It is your choice to choose the format and length of your chart. 3/ Use this chart and compare the patterns in this chart and the patterns in the chart of SP500. It allows to see if the two charts evolve with the same patterns or a little bit differently. If you have time, you can compare also with the chart of competitors. It is often a way to find if one stock is following the pattern of another stock with delay, or at the same time. It can be a useful way to trade. 6/ Make a recommendation such as buy, short, or wait. However, you have to provide explanations. If you decide to wait, try to explain what you are waiting for to trigger a trade. 7/ You are free to innovative and come up with other indicators or construct other indicators on Excel, or anything else that is technical to complete your analysis
Step by Step Solution
There are 3 Steps involved in it
Step: 1

Get Instant Access to Expert-Tailored Solutions
See step-by-step solutions with expert insights and AI powered tools for academic success
Step: 2

Step: 3

Ace Your Homework with AI
Get the answers you need in no time with our AI-driven, step-by-step assistance
Get Started


