Answered step by step
Verified Expert Solution
Question
1 Approved Answer
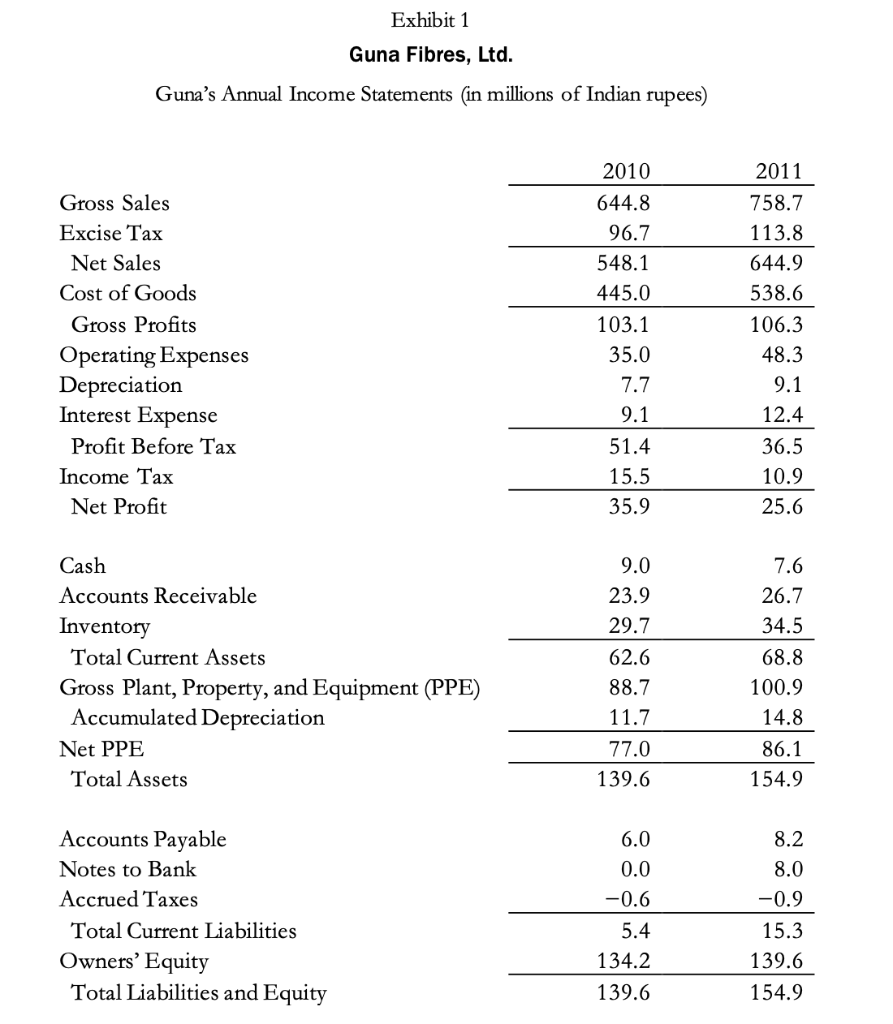
Is Guna Fibres, Ltd., a financially healthy business? As part of your assessment, consider the return on assets of the business. Exhibit 1 Guna Fibres,
Is Guna Fibres, Ltd., a financially healthy business? As part of your assessment, consider the return on assets of the business.


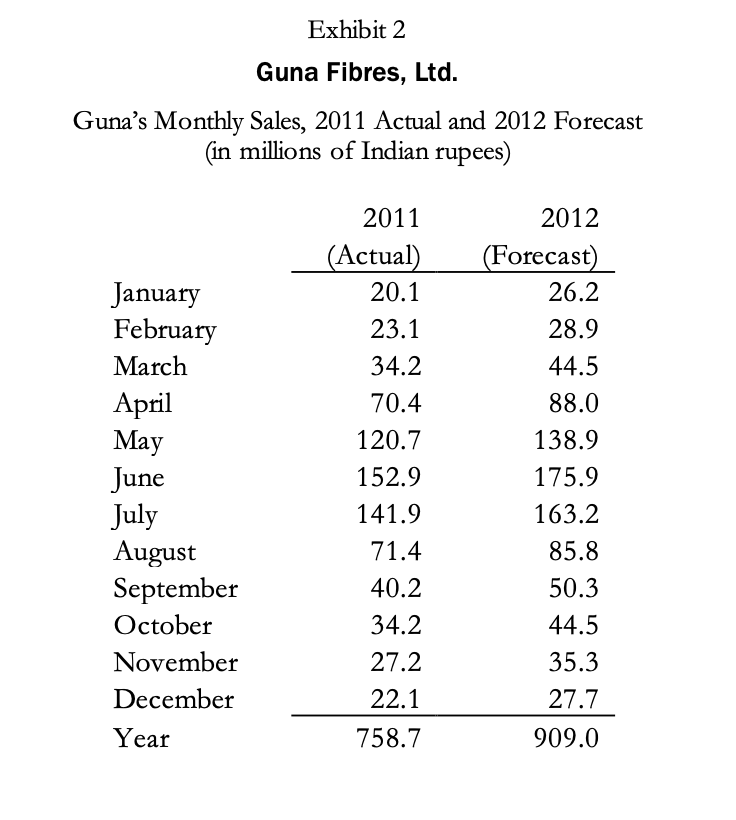
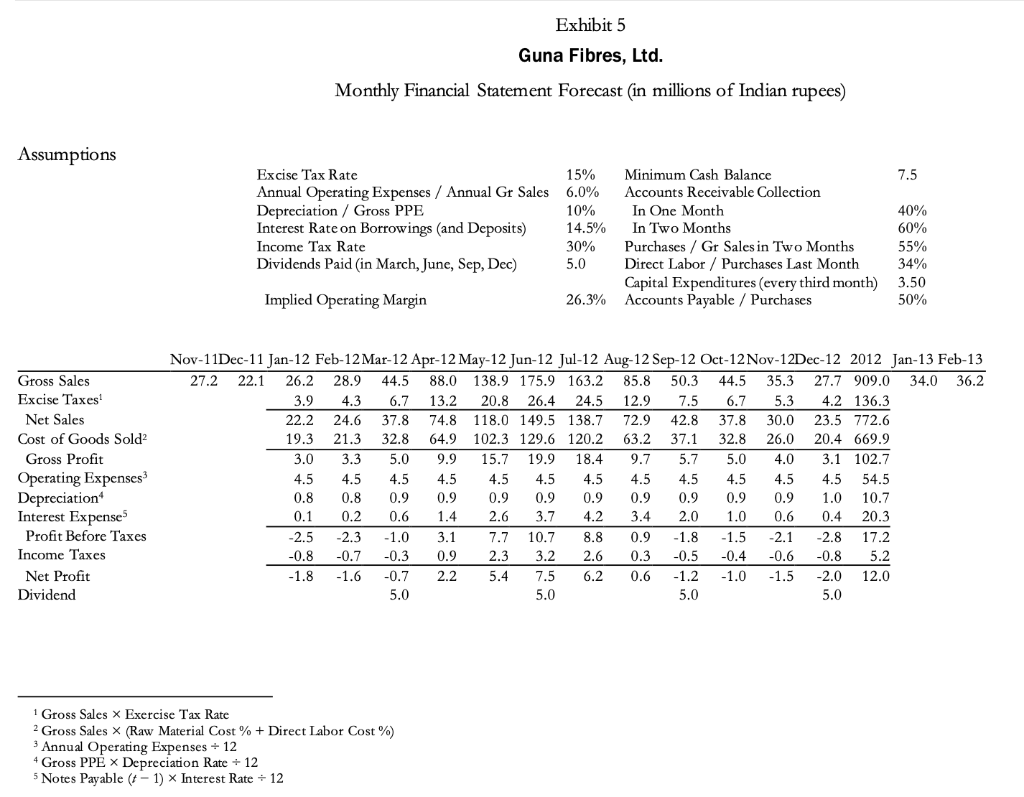
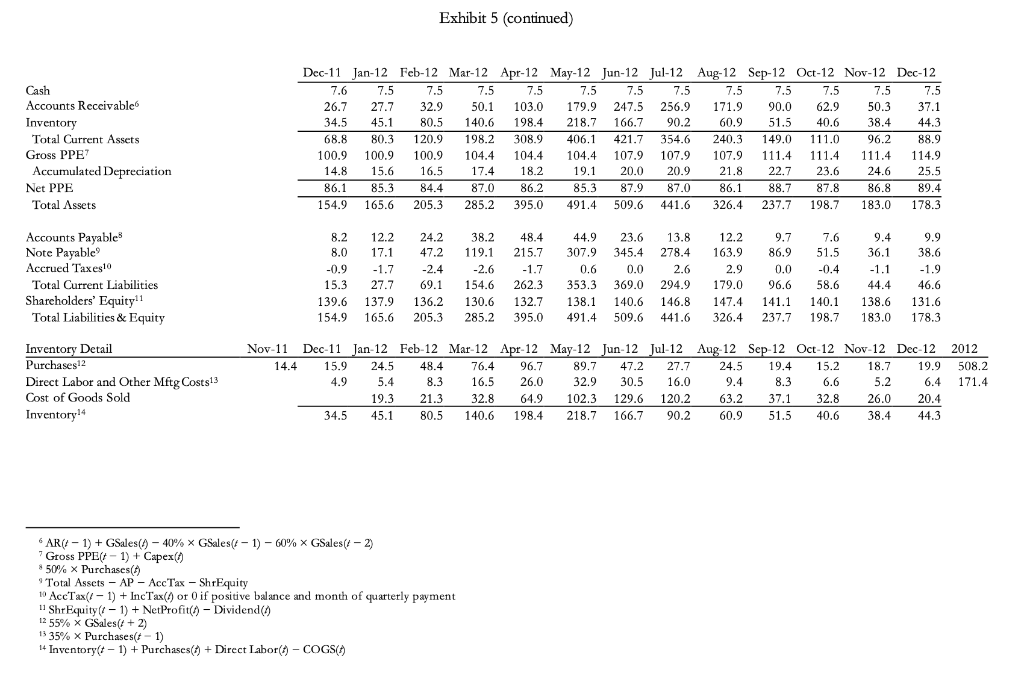
Exhibit 1 Guna Fibres, Ltd. Guna's Annual Income Statements (in millions of Indian rupees) 2010 644.8 96.7 548.1 445.0 Gross Sales Excise Tax Net Sales Cost of Goods Gross Profits Operating Expenses Depreciation Interest Expense Profit Before Tax Income Tax Net Profit 103.1 35.0 7.7 9.1 51.4 15.5 35.9 2011 758.7 113.8 644.9 538.6 106.3 48.3 9.1 12.4 36.5 10.9 25.6 Cash Accounts Receivable Inventory Total Current Assets Gross Plant, Property, and Equipment (PPE) Accumulated Depreciation Net PPE Total Assets 9.0 23.9 29.7 62.6 88.7 11.7 77.0 139.6 7.6 26.7 34.5 68.8 100.9 14.8 86.1 154.9 Accounts Payable Notes to Bank Accrued Taxes Total Current Liabilities Owners' Equity Total Liabilities and Equity 6.0 0.0 -0.6 5.4 134.2 139.6 8.2 8.0 -0.9 15.3 139.6 154.9 Exhibit 2 Guna Fibres, Ltd. Guna's Monthly Sales, 2011 Actual and 2012 Forecast (in millions of Indian rupees) January February March April May June July August September October November December Year 2011 (Actual) 20.1 23.1 34.2 70.4 120.7 152.9 141.9 71.4 40.2 34.2 27.2 22.1 2012 (Forecast) 26.2 28.9 44.5 88.0 138.9 175.9 163.2 85.8 50.3 44.5 35.3 27.7 909.0 758.7 Exhibit 5 Guna Fibres, Ltd. Monthly Financial Statement Forecast (in millions of Indian rupees) Assumptions Excise Tax Rate 15% Annual Operating Expenses / Annual Gr Sales 6.0% Depreciation / Gross PPE 10% Interest Rate on Borrowings and Deposits) 14.5% Income Tax Rate 30% Dividends Paid (in March, June, Sep, Dec) 5.0 Minimum Cash Balance 7.5 Accounts Receivable Collection In One Month 40% In Two Months 60% Purchases / Gr Sales in Two Months 55% Direct Labor / Purchases Last Month 34% Capital Expenditures (every third month) 3.50 Accounts Payable / Purchases 50% Implied Operating Margin 26.3% Gross Sales Excise Taxes! Net Sales Cost of Goods Sold? Gross Profit Operating Expenses Depreciation Interest Expense Profit Before Taxes Income Taxes Net Profit Dividend Nov-11Dec-11 Jan-12 Feb-12 Mar-12 Apr-12 May-12 Jun-12 Jul-12 Aug-12 Sep-12 Oct-12 Nov-12Dec-12 2012 Jan-13 Feb-13 27.2 22.1 26.2 28.9 44.5 88.0 138.9 175.9 163.2 85.8 50.3 44.5 35.3 27.7 909.0 34.0 36.2 3.9 4.3 6.7 13.2 20.8 26.4 24.5 12.9 7.5 6.7 5.3 4.2 136.3 22.2 24.6 37.8 74.8 118.0 149.5 138.7 72.9 42.8 37.8 30.0 23.5 772.6 19.3 21.3 32.8 64.9 102.3 129.6 120.2 63.2 37.1 32.8 26.0 20.4 669.9 3.0 3.3 5.0 9.9 15.7 19.9 18.4 9.7 5.7 5.0 4.0 3.1 102.7 4.5 4.5 4.5 4.5 4.5 4.5 4.5 4.5 4.5 4.5 4.5 4.5 54.5 0.8 0.8 0.9 0.9 0.9 0.9 0.9 0.9 0.9 0.9 0.9 1.0 10.7 0.1 0.2 0.6 1.4 2.6 3.7 4.2 3.4 2.0 1.0 0.6 0.4 20.3 -2.5 -2.3 -1.0 3.1 7.7 10.7 8.8 0.9 1.8 -1.5 -2.1 -2.8 17.2 -0.8 -0.7 -0.3 0.9 2.3 3.2 2.6 0.3 -0.5 -0.4 -0.6 -0.8 5.2 -1.8 -1.6 -0.7 2.2 5.4 7.5 6.2 0.6 -1.2 -1.0 -1.5 -2.0 12.0 5.0 5.0 5.0 5.0 1 Gross Sales X Exercise Tax Rate 2 Gross Sales (Raw Material Cost % + Direct Labor Cost %) 3 Annual Operating Expenses + 12 4 Gross PPE Depreciation Rate = 12 5 Notes Payable (+ - 1) Interest Rate = 12 Exhibit 5 (continued) Cash Accounts Receivable Inventory Total Current Assets Gross PPE Accumulated Depreciation Net PPE Total Assets Dec-11 Jan-12 Feb-12 Mar-12 Apr-12 May-12 Jun-12 Jul-12 Aug-12 Scp-12 Oct-12 Nov-12 Dec-12 7.6 7.5 7.5 7.5 7.5 7.5 7.5 7.5 7.5 7.5 7.5 7.5 7.5 26.7 27.7 32.9 50.1 103.0 179.9 247.5 256.9 171.9 90.0 62.9 50.3 37.1 34.5 45.1 80.5 140.6 198.4 218.7 166.7 90.2 60.9 51.5 40.6 38.4 44.3 68.8 80.3 120.9 198.2 308.9 406.1 421.7 354.6 240.3 149.0 111.0 96.2 88.9 100.9 100.9 100.9 104.4 104.4 104.4 107.9 107.9 107.9 111.4 111.4 111.4 114.9 14.8 15.6 16.5 17.4 18.2 19.1 20.0 20.9 21.8 22.7 23.6 24.6 25.5 86.1 85.3 84.4 87.0 86.2 85.3 87.9 87.0 86.1 88.7 87.8 86.8 89.4 154.9 165.6 205.3 285.2 395.0 491.4 509.6 441.6 326.4 237.7 198.7 183.0 178.3 Accounts Payable Note Payable Accrued Taxes10 Total Current Liabilities Shareholders' Equity!! Total Liabilities & Equity 8.2 12.2 24.2 38.2 48.4 44.9 23.6 13.8 12.2 9.7 7.6 9.4 9.9 8.0 17.1 47.2 119.1 215.7 307.9 345.4 278.4 163.9 86.9 51.5 36.1 38.6 -0.9 -1.7 -2.4 -2.6 -1.7 0.6 0.0 2.6 2.9 0.0 -0.4 -1.1 -1.9 15.3 27.7 69.1 154.6 2623 353.3 369.0 294.9 179.0 96.6 58.6 44.4 46.6 139.6 137.9 136.2 130.6 132.7 138.1 140.6 146.8 147.4 141.1 140.1 138.6 131.6 154.9 165.6 205.3 285.2 395.0 491.4 509.6 441.6 326.4 237.7 198.7 183.0 178.3 Nov-11 Dec-11 Jan 12 Feb-12 Mar-12 Apr-12 May-12 Jun-12 Jul 12 Aug 12 Sep 12 Oct-12 Nov-12 Dec 12 14.4 15.9 24.5 48.4 76.4 96.7 89.7 47.2 27.7 24.5 19.4 15.2 18.7 19.9 4.9 5.4 8.3 16.5 26.0 32.9 30.5 16.0 9.4 8.3 6.6 5.2 6.4 19.3 21.3 32.8 64.9 102.3 129.6 120.2 63.2 37.1 32.8 26.0 20.4 34.5 45.1 80.5 140.6 198.4 218.7 166.7 90.2 60.9 51.5 40.6 38.4 44.3 Inventory Detail Purchasest2 Direct Labor and Other Mftg Costs13 Cost of Goods Sold Inventory! 2012 508.2 171.4 6 AR(1 - 1) + GSales(1) - 40% x GSales(1 - 1) - 60% X GSales(1 - 2) Gross PPE(-1) + Capex() $ 50% X Purchases (6) Total Assets - AP - Acc Tax - ShrEquity 10 AceTax(1 - 1) + IncTax(/) or 0 if positive balance and month of quarterly payment 11 ShrEquity (1 - 1) + NetProfit() - Dividend() 12 55% X GSales(t + 2) 1535% X Purchases(t - 14 Inventory(t - 1) + Purchases(7) + Direct Labor() - COGS(7)
Step by Step Solution
There are 3 Steps involved in it
Step: 1

Get Instant Access to Expert-Tailored Solutions
See step-by-step solutions with expert insights and AI powered tools for academic success
Step: 2

Step: 3

Ace Your Homework with AI
Get the answers you need in no time with our AI-driven, step-by-step assistance
Get Started


