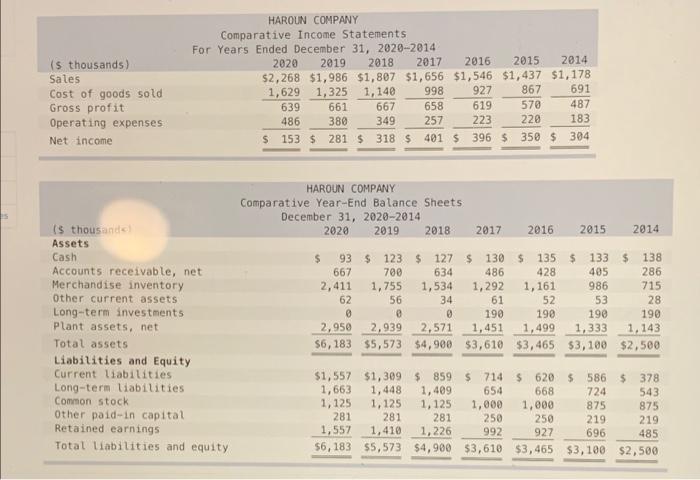
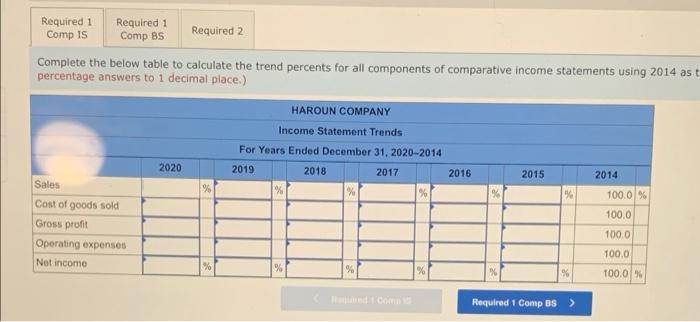
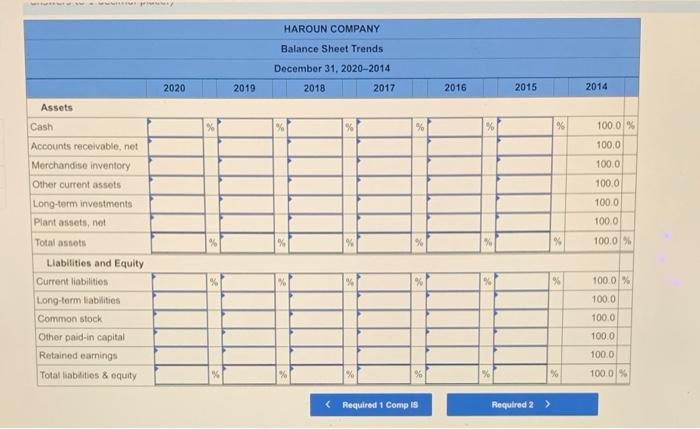
is thousands) Sales Cost of goods sold Gross profit Operating expenses Net income HAROUN COMPANY Comparative Income Statements For Years Ended December 31, 2020-2014 2020 2019 2018 2017 2016 2015 2014 $2,268 $1,986 $1,807 $1,656 $1,546 $1,437 $1,178 1,629 1,325 1,140 998 927 867 691 639 661 667 658 619 570 487 486 380 257 223 228 183 $ 153 $ 281 $ 318 $ 401 $ 396 $ 350 $ 304 349 HAROUN COMPANY Comparative Year-End Balance Sheets December 31, 2020-2014 2020 2019 2018 2017 2016 2015 2014 ($ thousand Assets Cash Accounts receivable, net Merchandise inventory Other current assets Long-term investments plant assets, net Total assets Liabilities and Equity Current liabilities Long-term liabilities Common stock Other paid-in capital Retained earnings Total liabilities and equity $ 93 $ 123 $ 127 $ 130$ 135 $ 133 $ 138 667 700 634 486 428 405 286 2,411 1,755 1,534 1,292 1,161 986 715 62 56 34 61 52 53 28 0 190 190 190 2,950 2,939 2,571 1,451 1,499 1,333 1,143 56,183 $5,573 $4,900 $3,610 $3,465 $3,100 $2,500 190 668 $1,557 $1,399 $ 859 $ 714 $ 620 $ 586 $ 378 1,663 1,448 1,409 654 724 543 1,125 1,125 1,125 1,000 1,000 875 875 281 281 281 250 250 219 219 1,557 1,410 1,226 992 927 696 485 $6,183 $5,573 $4,900 $3,610 $3,465 $3,100 $2,500 Required 1 Required 1 Comp IS Comp BS Required 2 Complete the below table to calculate the trend percents for all components of comparative income statements using 2014 ast percentage answers to 1 decimal place.) HAROUN COMPANY Income Statement Trends For Years Ended December 31, 2020-2014 2019 2018 2017 2020 2016 2015 2014 % 9 % 100.0% 100.0 Sales Cost of goods sold Gross profit Operating expenses Not income 100.0 100.0 % % % % 100.0 % Required 1 Comp Bs > - HAROUN COMPANY Balance Sheet Trends December 31, 2020-2014 2020 2019 2018 2017 2016 2015 2014 Assets % % % % % 100.0 % 100.0 100.0 Cash Accounts receivable.net Merchandise inventory Other current assets Long-term investments Plant assets, net 100.0 100.0 100.0 Total assets 100.0 % 100.0% 100.0 Liabilities and Equity Current liabilities Long-term liabilities Common stock Other paid in capital Retained earnings Total liabilities & equity 100.0 100.0 100.0 100.0 % % %


